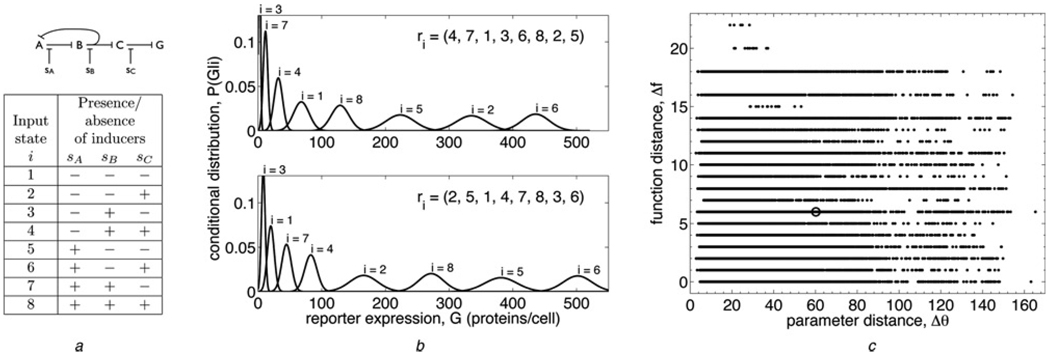
Figure 1. Defining evolvability.
a Top: a sample regulatory network (see Fig. 2 for diagrams of all 24 networks studied). A, B and C are genes whose transcription factors regulate each other’s expression according to the given network topology, and G is a ‘reporter’ gene, such as GFP. Sharp arrows indicate up-regulation, whereas blunt arrows indicate down-regulation (all arrows are blunt in this network). sA, sB and sC are chemical inducers that reduce the efficacy of the corresponding transcription factors. Bottom: table showing the eight input states i that are defined by the presence or absence of each chemical inducer in the cell (+ indicates presence and − indicates absence). In the model, the sA, sB and sC are scale factors that are free parameters (greater than 1, to effect an interference with transcriptional regulation) if the inducer is present, and are set to 1 if the inducer is absent
b Two maximally informative functions performed by the sample network at two different parameter settings. Function is characterized by the order of the output distributions P(G|i), the probability of expressing G proteins per cell given that the system is in input state i. Specifically, the function is quantified by the vector r⃗ of ranks of the P(G|i), as shown for each function in the upper right corner. For example, in the top function, the first output distribution (i = 1) is ranked 4th, the second (i = 2) is ranked 7th, the third (i = 3) is ranked 1st and so on, so the rank vector is r⃗ = (4, 7, 1, …)
c Plot of function distance Δf (9) against parameter distance Δθ (8) for all pairs of maximally informative model solutions (340 solutions were used for this network). Function distance is scaled such that the swapping of two adjacent output states from solution one to solution two gives Δf = 1, and parameter distance is scaled such that the doubling of one parameter from solution one to solution two gives Δθ = 1. The point corresponding to the pair of functions in (b) is circled. The evolvability score for this network, calculated from these data via (10), is E = 0.482 ± 0.001

