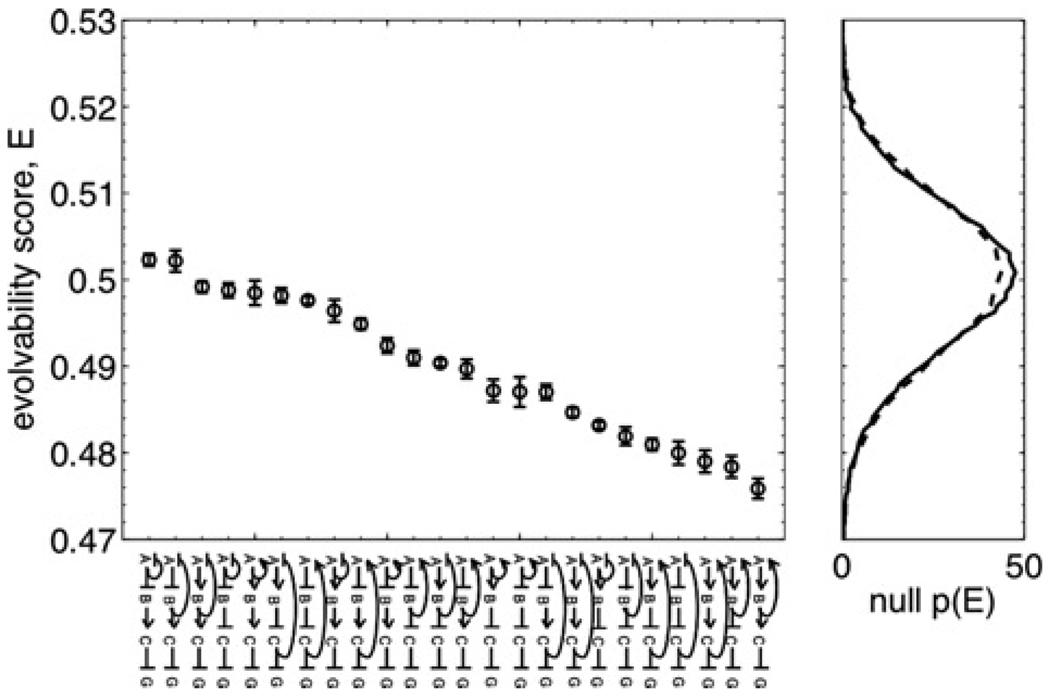
Figure 2. Evolvability scores for all networks.
Left: All 24 regulatory networks studied are shown along the horizontal axis, ranked by evolvability score E (sharp arrows denote up-regulation, and blunt arrows denote down-regulation). E values are calculated via (10), with error bars showing the sampling error, calculated as described in the text.
Right: Two null distributions generated according to the null hypothesis that the function distance is independent of the parameter distance. The solid line is the distribution of E scores calculated from solution sets in which the locations in parameter space were held fixed, and the function assignments were randomly permuted. The dotted line is the distribution of E scores calculated from solution sets in which the locations in parameter space were held fixed, and the function assignments were drawn randomly from the set of possible functions for the given network. Both distributions are averages over the individual distributions for each network, as there was no correlation between the means or variances of the individual distributions and the networks’ E scores

