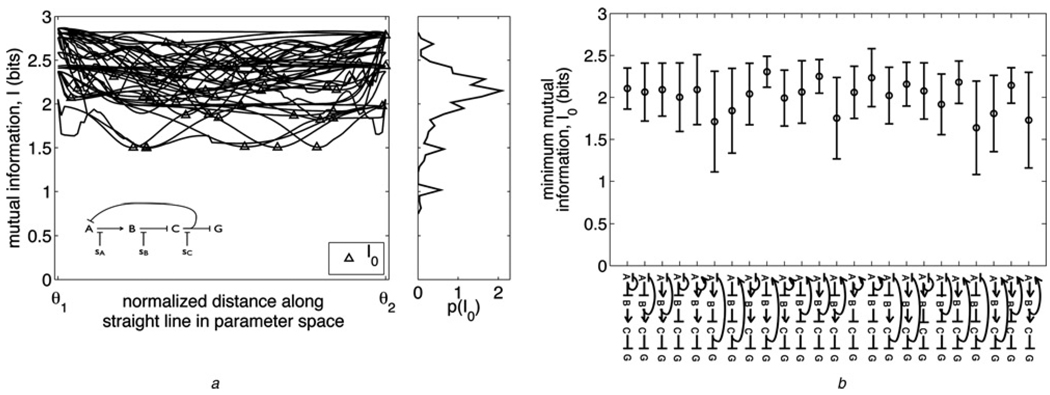
Figure 3. Changing function without losing information.
a Left: Mutual information I along straight-line paths in parameter space between pairs of 10 randomly chosen optimally informative model solutions for a particular network (inset). For each path, the starting and ending solution’s locations in parameter space are denoted θ⃗1 and θ⃗2, respectively, on the horizontal axis. The minimum mutual information I0 along each path is marked with a triangle. A specific function is performed at each of the ten solutions (as characterised in Methods); seven of the ten functions are unique. Right: Distribution of I0 values built from paths between 37 randomly chosen solutions for the inset network, of which the ten solutions used for the left plot are a subset
b Means (circles) and standard deviations (error bars) of I0 distributions like that in (a) (right), for all networks studied; 37 randomly chosen solutions were used to build each network’s distribution. Networks are shown on the horizontal axis, in the same order as in Fig. 2, i.e. ranked by evolvability score E

