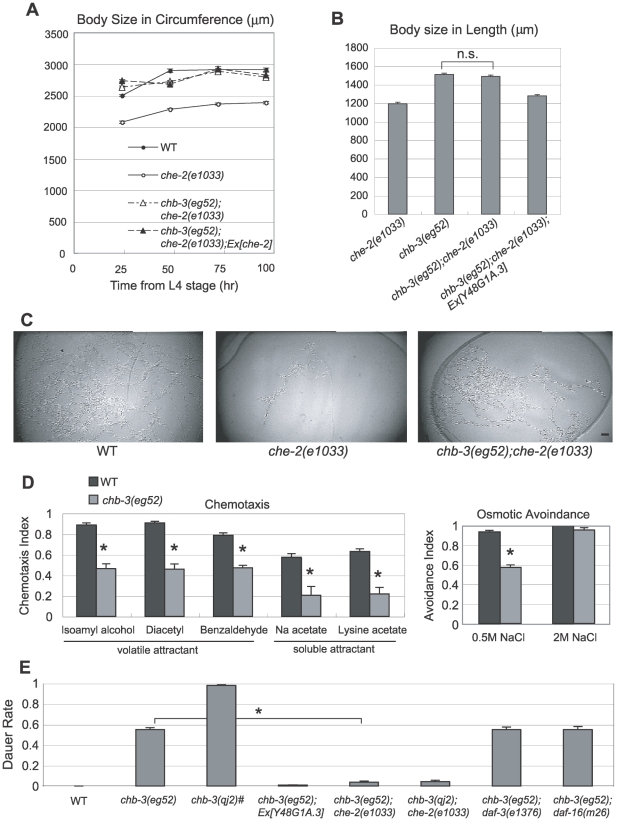
Figure 1. chb-3 is a che-2 small-body-size suppressor.
(A) Time course of changes in body size indicated by the length of the perimeter of the lateral image of the animals. Body size was measured at the indicated time points from the L4 stage. Error bars indicate the standard error of the mean (s.e.m). (B) Body size indicated by the length of the animals 48 hours after the L4 stage. “n.s.” indicates that the difference is not significant (p>0.05, t test). (C) Typical tracks left by a single animal on an E. coli lawn during an 18-hours period. Scale bar, 10 mm. (D) Chemotaxis and osmotic avoidance assays. Each data point represents an average of at least 3 independent assays. Error bars indicate s.e.m. The mark (*) indicates the significant difference (p<0.01, t test). (E) The rate of dauer formation at 20°C. The Daf-c phenotype of chb-3 was suppressed by che-2(e1033) but not by daf-3(e1376) or daf-16(m26). Rescue of the chb-3(eg52) Daf-c phenotype by the Y48G1A.3 transgene (Ex[Y48G1A.3/myo-3::gfp]) is also shown. Each data point represents an average of at least 5 independent assays. Error bars indicate s.e.m. The mark (*) indicates the significant difference from chb-3(eg52) (p<0.01, t test). #The dauer formation rate of chb-3(qj2) was determined by gathering eggs from the chb-3(qj2); Ex[tax-4p::CHB-3::GFP] rescued line, and observing hatched animals that lost the Ex array.

