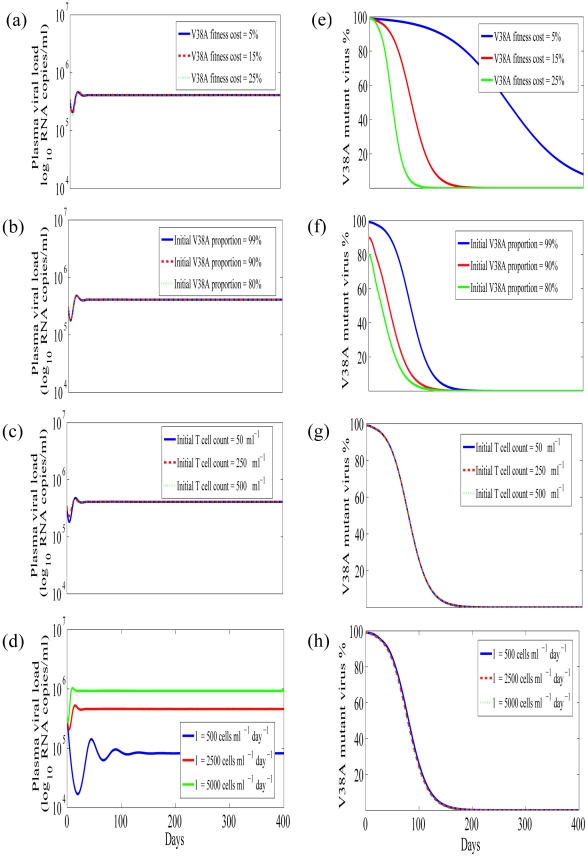
Figure 4. Simulation results during ENF interruption.
Plasma HIV-1 RNA level (a–d), and V38A mutant virus proportion (e–h), for different V38A mutant virus fitness costs (a,e), initial V38A mutant virus proportion (b,f), initial T cell counts (c,g) and T cell source rate (d,h). Parameters used are the average values of P1, P2, P3 in Table 1.

