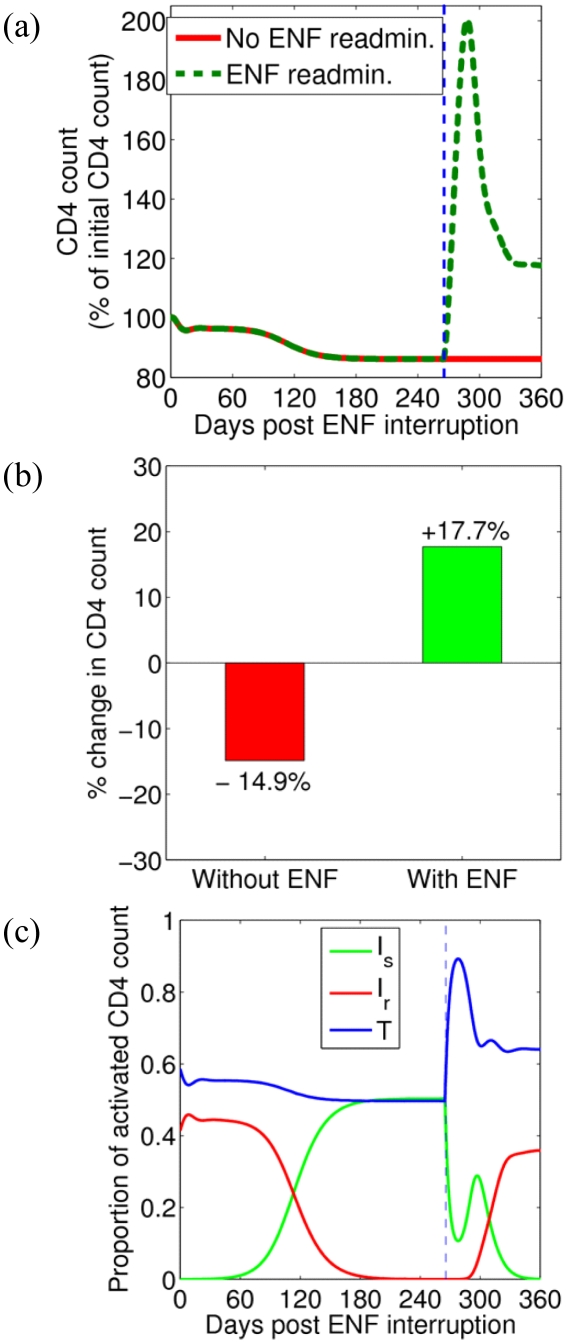
Figure 6. CD4 count and the proportion of uninfected and infected cells.
(a) Predicted temporal variation of the CD4 count during ENF interruption (red) and with ENF re-administration (green). Parameters used are the average values in Tables 1 and 3. The vertical dashed line indicates the time of ENF re-administration. (b) Bar diagram showing the percentage change of CD4 count at the end of one year without ENF (red) and at the end of 3 months with ENF re-administration (green). (c) Change over time of the proportion of uninfected cells, T (blue), cells infected with drug-sensitive virus, Is (green), and cells infected with drug-resistant virus, Ir (red). The vertical dashed line indicates the time of ENF re-administration.

