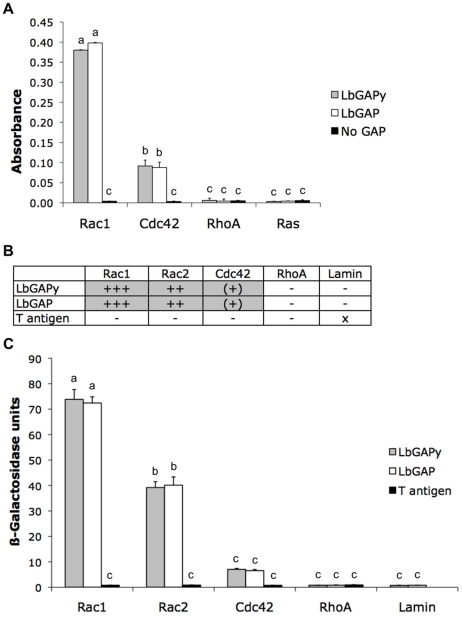
Figure 3. LbGAPy displays a GAP activity in vitro and interacts with D. melanogaster Rac1 and Rac2.
(A) Absorbance at 650 nm, which is correlated with the amount of Pi released from GTP-bound human Rac1, Cdc42, RhoA or Ras, was measured in the presence of LbGAPy or LbGAP or in the absence of any GAP. Bars: GAP activity in the presence of LbGAPy (grey bars), in the presence of LbGAP (open bars), in the absence of GAP (black bars). For each value, error bars represent the standard error of three measurements. (B) Results based on growth on selective medium lacking histidine and qualitative ß-galactosidase overlay assays. x : non-tested; − : no interaction; (+) : very weak interaction; ++ : mean interaction, ++++ : strong interaction. (C) Interactions with Rac1G12V, Rac2G12V, Cdc42G12V, RhoAG14V and Lamin (negative control) assayed by measuring beta-galactosidase activity in total protein extracts. Grey bars : beta-galactosidase activity in the presence of LbGAPy. Open bars : beta-galactosidase activity in the presence of LbGAP. Black bars : beta-galactosidase activity in the presence of T antigen (negative control). For each value, error bars represent the standard error of three measurements.

