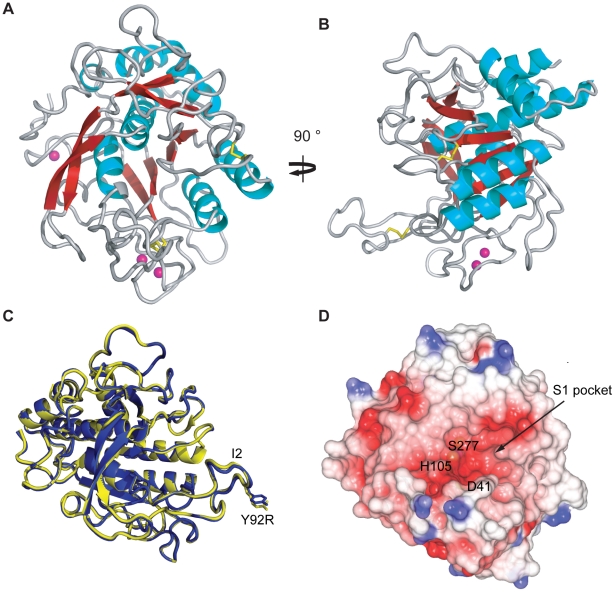
Figure 5. Crystal structure of AprV2.
(A) and (B) Cartoon representation of AprV2. Two views differing by 90° are shown. Disulphide bonds are shown in yellow stick representation. Calcium ions found in the crystal structure are shown as pink spheres. (C) An overlay of the crystal structures of AprV2 (blue) and AprB2 (yellow). The structures are shown as a Cα trace. The I2 loop is labelled. Tyr 92 in AprV2 and Arg 92 in AprB2 are shown in stick representation and labelled. (D) Electrostatic potential surface of AprV2 generated using CCP4mg [50]. Positively charged electrostatic potential is coloured blue and negatively charged electrostatic potential is coloured red. The location of the active site residues is indicated. The location of the S1 binding pocket is indicated. (A), (B) and (C) were prepared using PyMol [51]. The structural alignment in (C) was prepared using MUSTANG [52]. Secondary structure elements were calculated using stride [53].

