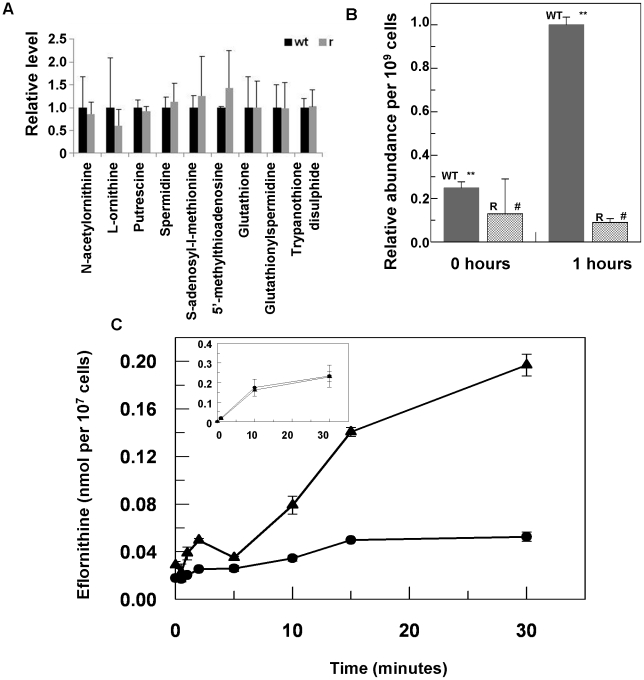
Figure 3. Metabolomic analysis of eflornithine resistance and uptake.
(A), Relative abundance of polyamine metabolites in wildtype (WT) and eflornithine resistant (R) cell extracts. (B), Uptake of eflornithine in wildtype (filled bars) and resistant cells (hatched bars) over one hour. Stars indicate a significant difference at a 0.01 level between WT at time 0 and WT after 60 minutes. A hash indicates that R at time 0 and R after 60 minutes show no significant difference at a 0.05 level. (C), Eflornithine uptake in wildtype and resistant cells. 3H-eflornithine transported into wildtype (triangles) and resistant (circles) cells was measured over 30 minutes. Measurements are an average of four separate experiments, each with three internal replicates. Error bars are the standard error of the mean. Inset graph shows threonine uptake in the same cell lines. The y-axis shows nmol of threonine per 107 cells. The x-axis shows the time in minutes.

