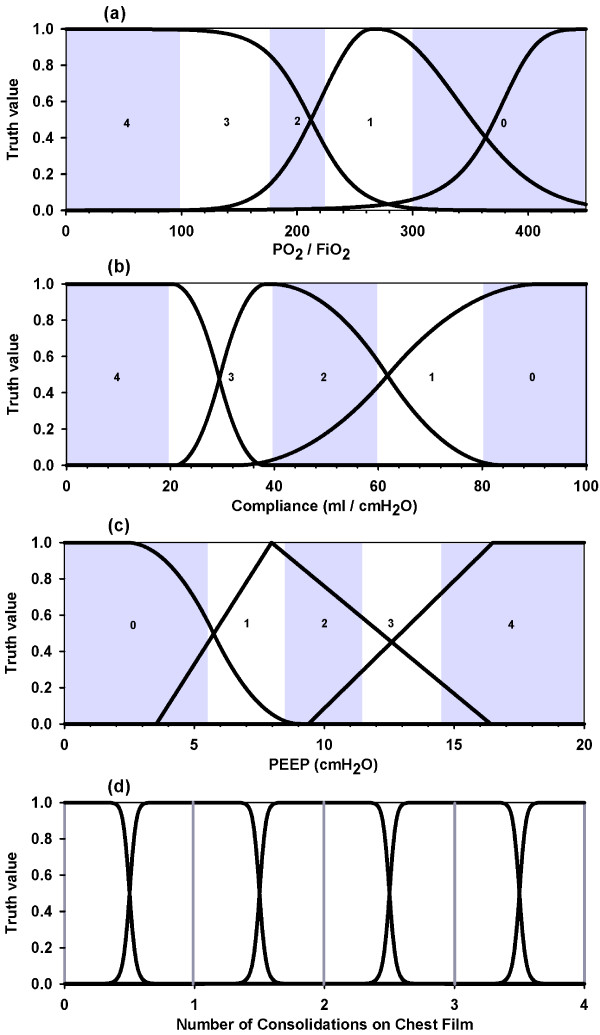
Figure 1.
Membership functions of Murray variables. (a) PO2/FiO2 functions: severe, moderate and normal (left to right). (b) Compliance functions: severely diminished, moderately diminished and normal (left to right). (c) PEEP functions: low, moderate and high (left to right). (d) Chest film functions: for 0 through 4 quadrants consolidations; vertical lines at 0, 1, 2, 3 and 4 represent Murray's values assigned to this variable. Murray bands (grey and white strips) were drawn superimposed in the first three graphs and bands' values are seen embedded in them.

