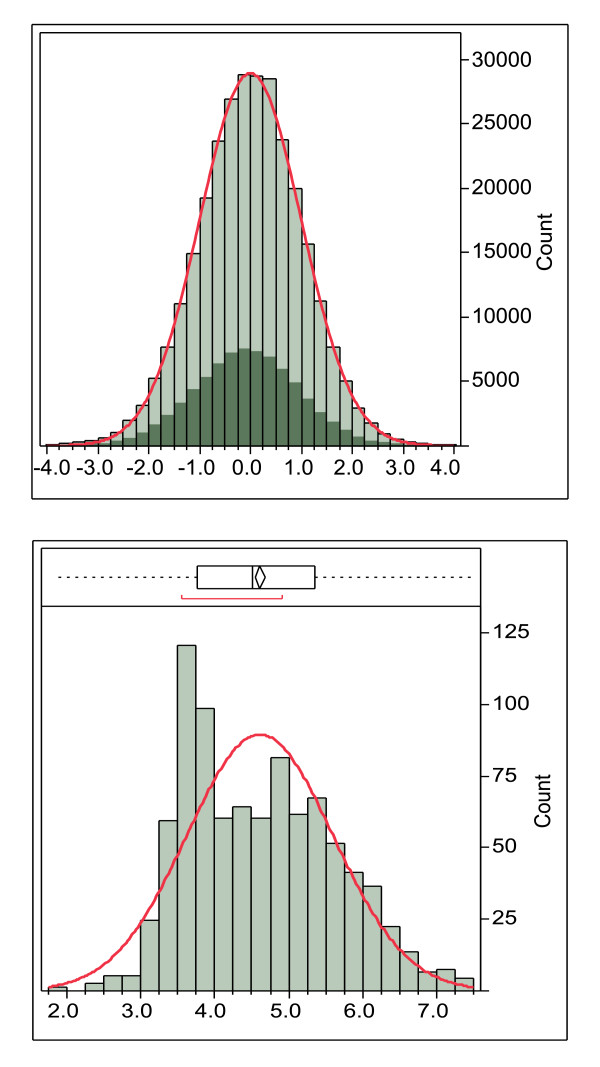
Figure 2.
Example of the global standardization process. The global standardization process using DRB*0101 15-mers of the combined secretome and surfome from NC_002951 Staphylococcus aureus COL (289,760 peptides). The highlighted area shows the peptides with an N-terminal amino acid predicted to be in a membrane that is shifted from the mean in the original data but is coincident with the mean after standardization. Lower panel. Average lnN(ic50) of DRB*0101 15-mers done on a protein basis. In this case the histogram bars are the number of proteins with the indicated ln(ic50). The non-normal distribution is caused by proteins with transmembrane domains with higher binding affinity.

