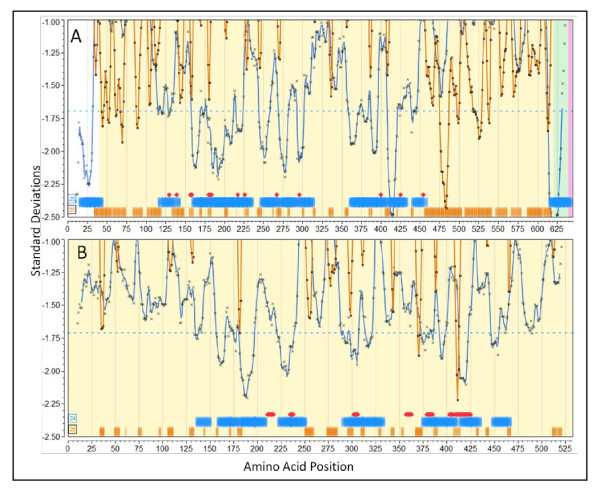
Figure 6.
Predicted and experimentally mapped epitope regions for two proteins from Staphylococcus aureus COL (NC_002951). Graphic overlay using proteome-wide standardization of scoring metrics. Blue line is the predicted population phenotypic MHC-II binding. This is computed as described in the methods for fourteen MHC-II alleles permuted as dizygotic combinations within a window ± 4 of the amino acid position indicated. The orange line is the predicted B-cell epitope probability for the particular amino acid being within a B-cell epitope. Actual computed data points are plotted along with the line that is the result of smoothing with a polynomial filter [49]. Blue horizontal bands are the regions of high probability MHC II binding phenotype and orange horizontal bars are high probability predicted B-cell epitope regions. The percentile probabilities used as the threshold are as described in the text and is indicated in the number within the box at the left. The red diamonds (or groups thereof) are experimentally mapped regions of Ig binding. The experimental mapping is described in more detail in Additional File 3 Table S3a. (A) LPXTG cell wall surface anchor protein, IsdB (GI:57651738) [51]. (B) ABC transporter, ATP-binding protein (GI:57651892) [52].

