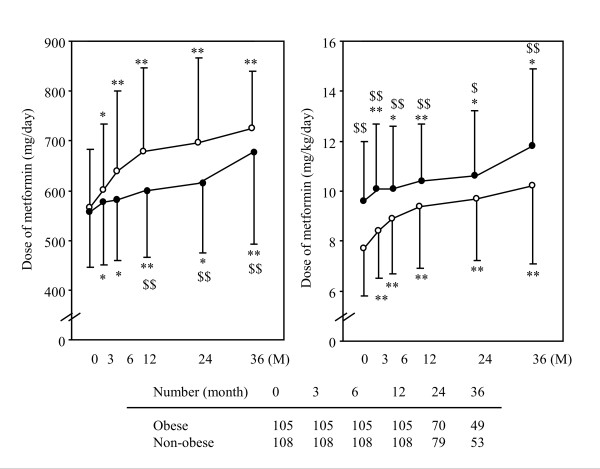
Figure 3.
Changes in the dose of metformin and those corrected by the patient's body weight. Data represent the mean ± SD. Open and closed circles represent the values in obese and non-obese individuals, respectively. * P < 0.05 and ** P < 0.01 vs. 0 M (initiation of metformin). $ P < 0.05 and $$ P < 0.01 vs. obese.

