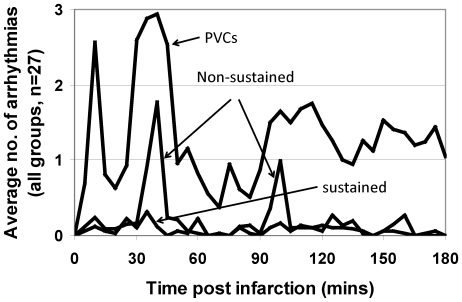
Figure 1. Time course of arrhythmias.
Graphs of the average number of arrhythmias per animal in each 5 minute time period over the duration of each experiment for each of the three groups of arrhythmias: PVCs (including single and multiple PVCs and alternating rhythms such as bigeminy and trigeminy), non-sustained ventricular tachycardia and ventricular fibrillation (lasting for more than 1 s but self-terminating within 15 s of commencement), and sustained ventricular tachycardia and ventricular fibrillation (lasting for more than 15 s and requiring cardioversion or defibrillation). Note that the number of PVCs shown is 1/10th of the actual number of PVCs recorded (to enable display on the same graph). The periods of peak arrhythmia activity can be seen to extend between 0 and 20 mins, 20 and 50 mins, and 50 and 180 mins, corresponding to Phase 1a, Phase 1b and Phase 2 arrhythmias respectively.

