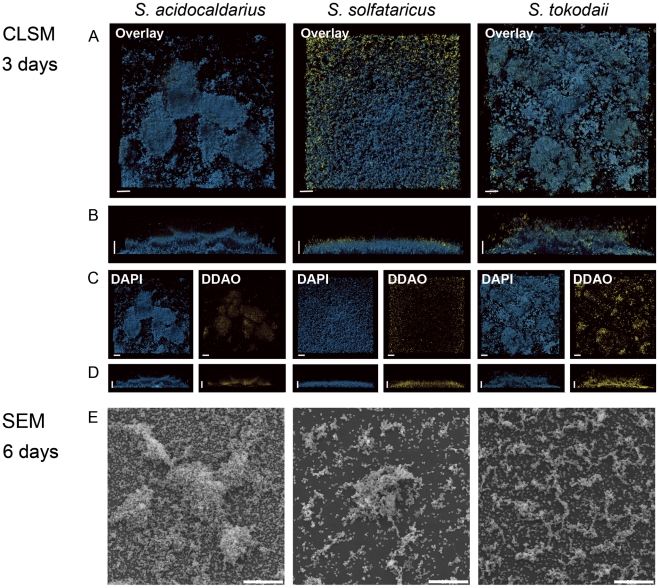
Figure 2. Different structures of static biofilms formed by three Sulfolobus strains S. acidocaldarius, S. solfataricus and S. tokodaii visualized by CLSM and SEM.
A (top views) and B (side views) display the overlays of the images of three day old biofilms treated with DAPI and DDAO. The bar is 20 µm in length. C (top view) and D (side views) show the single channels of the overlays. DAPI signal: blue; DDAO signal: yellow. E, SEM images of biofilms of the three Sulfolobus strains incubated for 6 days. CLSM: confocal laser scanning microscopy; SEM: scanning electron microscopy.

