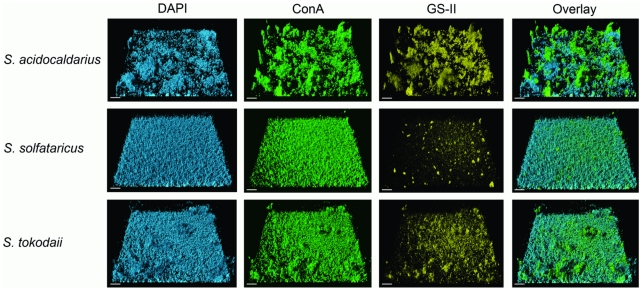
Figure 3. CSLM analysis of three day old static biofilms of S. acidocaldarius, S. solfataricus and S. tokodaii by lectin-staining.
After three days the biofilms of S. acidocaldarius (first row), S. solfataricus (second row) and S. tokodaii (last row) were incubated with DAPI and different lectins and were analyzed by CSLM. The first column displays the DAPI signal (blue), the second column the ConA signal (green), the third column the GSII signal (yellow) and the last column the overlay of the other three channels. Bars are 20 µm in length.

