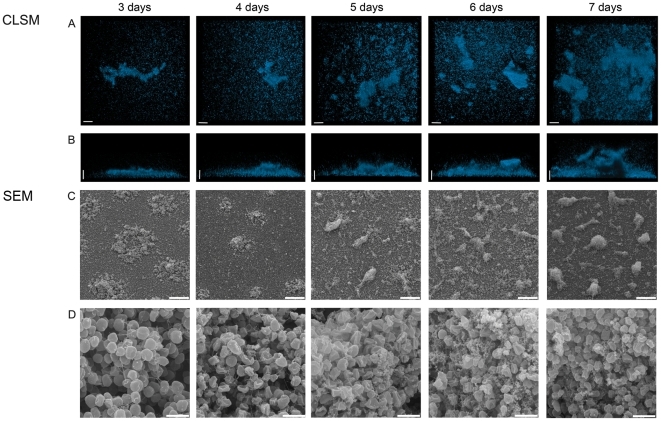
Figure 5. CLSM and SEM analysis of the development of a static biofilm of S. acidocaldarius during a time course of seven days.
DAPI signal (blue) in the top view (A) and the side view (B). SEM analysis showing an overview (C) and enlarged view (D) of the developing biofilm. Size standards are 20 µM in length for A and B, 40 µM in C and 2 µM in D. CLSM: confocal laser scanning microscopy; SEM: scanning electron microscopy.

