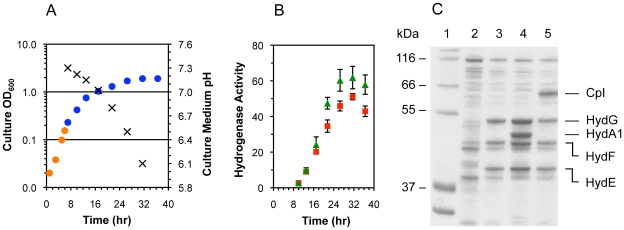
Figure 1. E. coli growth and anaerobic expression of heterologous active [FeFe] hydrogenases.
All data are for cultures of E. coli strain BL21(DE3) ΔiscR, and both iron and cysteine were included in the growth medium. (Fig. 1A) Optical density at 600 nm (shown on a logarithmic scale) of cultures during aerobic (orange circles) and anaerobic (blue circles) growth phases for cells containing the pACYCDuet-1–hydGX–hydEF and pET-21(b) shydA1*–Strep-tag II plasmids. The pH of culture media (×) was also measured. Data for cultures with cells containing the pET-21(b) shydA–Strep-tag II plasmid instead of pET-21(b) shydA1*–Strep-tag II were similar and are not shown. (Fig. 1B) Cell lysate-based hydrogenase activities (µmol MV reduced·min−1·mg−1 total protein) for active CpI (red squares) and HydA1 hydrogenase (green triangles) were determined using the methyl viologen reduction assay. Data are the average for n = 3 cultures examined ± standard deviations. (Fig. 1C) SDS-PAGE analysis for the soluble fractions of final cell lysates after the anoxic co-expression of HydA1 or CpI and the HydE, HydF, and HydG maturases: (Lane 1) the molecular weight markers are from the Mark12TM protein ladder (Invitrogen); (Lane 2) soluble cell lysate protein content for E. coli strain BL21(DE3) ΔiscR following expression of no heterologous proteins from recombinant DNA plasmids; (Lane 3) co-expression of only the HydE, HydF, and HydG maturases; (Lane 4) co-expression of HydE, HydF, HydG, and HydA1–Strep-tag II; and (Lane 5) co-expression of HydE, HydF, HydG, and CpI–Strep-tag II.

