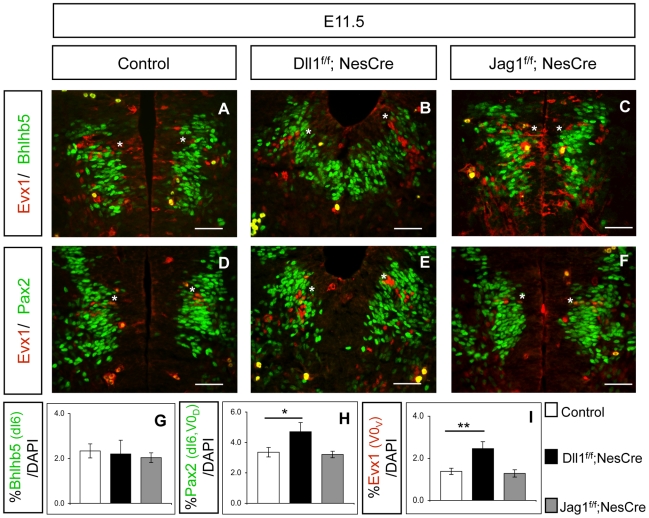
Figure 3. Ligand inactivation does not affect dI6 neurogenesis.
(A–F and I) Dll1 mutants show a 78% increase of Evx1+ V0V INs (indicated with asterisk), whereas V0 neurogenesis in Jag1 mutants is indistinguishable from that of control littermates. Scale bar 50 µm. Student's t-test: ** p<0.005. (A–C and G) Inactivation of either Dll1 or Jag1 does not alter Bhlhb5+ dI6 INs neurogenesis. Quantification was restricted to Bhlhb5+ INs, dorsally located to Evx1+ V0V INs. Scale bar 50 µm. (D–F and H) When compared to control embryos, Dll1 mutants show a 38% increase in Pax2+ dI6 and V0D INs, located between Evx1+ V0V INs and Pax2− dI5 INs. This increase is due to Pax2+/Bhlhb5−/Evx1− V0D INs overproduction and not an increase in Pax2+/Bhlhb5+/Evx1− dI6 neurogenesis. Number of Pax2+ dI6 and V0D INs is similar in Jag1 mutants and control littermates. Error bars represent s.d. for biological triplicates. Student's t-test: * p<0.05.

