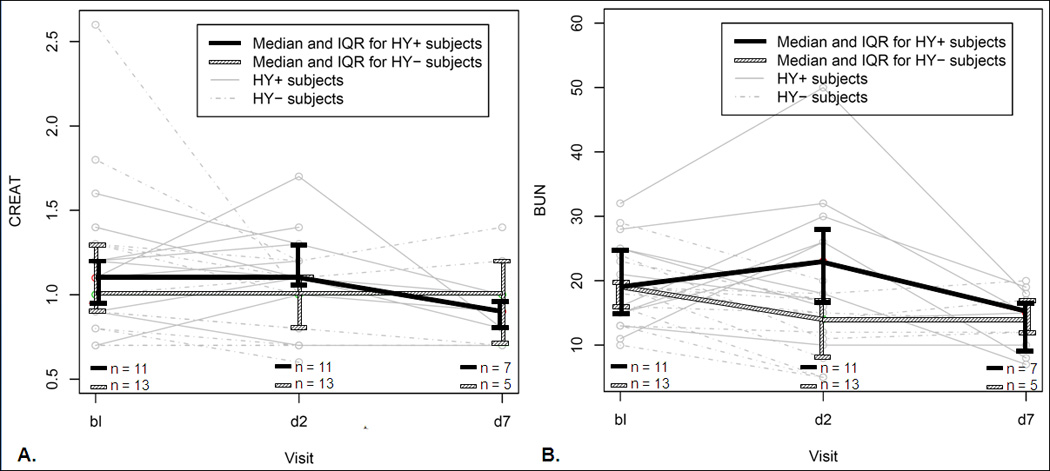
Figure 3.

A) Comparison between normothermic control and hypothermia patients’ serum creatinine (CREAT), and B) serum blood urea nitrogen (BUN). Individual patients are shown in grey in the background (solid lines, hypothermia; dashed lines, normothermia controls). Each thick line represents a group (black, hypothermia; hatched, normothermia), with median and interquartile range values shown at each time-point. Bl, baseline; d2, day 2 (post-treatment, at completion of hypothermia and re-warm); d7, day 7.
