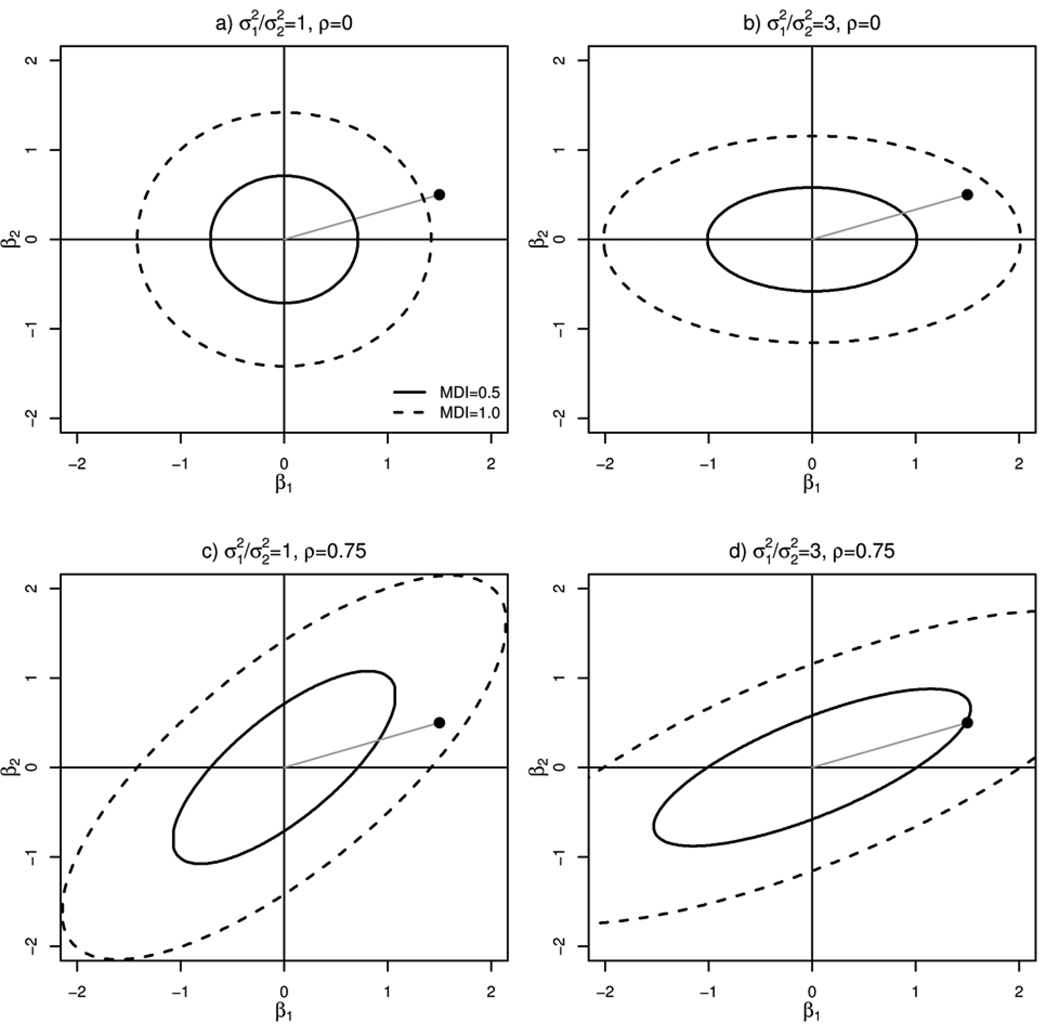
Figure 1.
Example Morbidity Dissimilarity Indices (MDI) for four configurations. MDIs were drawn for equal to (1, 0), (3,0), (1, 0.75), and (3, 0.75) in panels a), b), c), and d), respectively, where and ρ is the correlation between β1 and β2. Different values of correlations (ρ) effectively alter the angle between the axes, as shown in panels c and d. The solid and dashed contours display the set of all (β1, β2), that yield MDI equal to 0.5 and 1.0, respectively.

