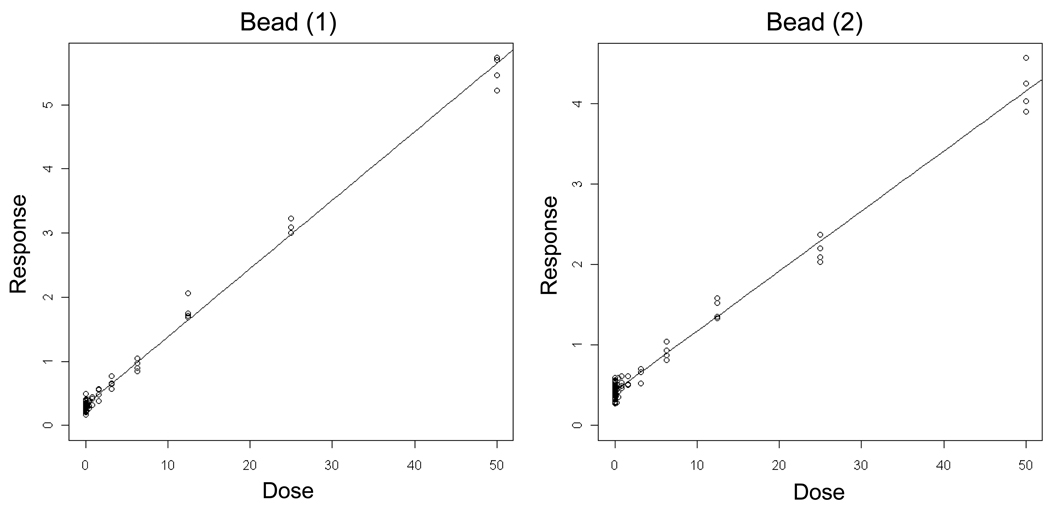
Figure 3.
Output from the hockey-stick program of Lutz and Lutz [19] is shown for two independent microsphere (“Bead”) simulation experiments. In these examples, the frequency (%) of red fluorescence microspheres determined via flow cytometric analysis is graphed as a function of their known incidence. The results and corresponding p-values indicate that these data are best described by linear fits.

