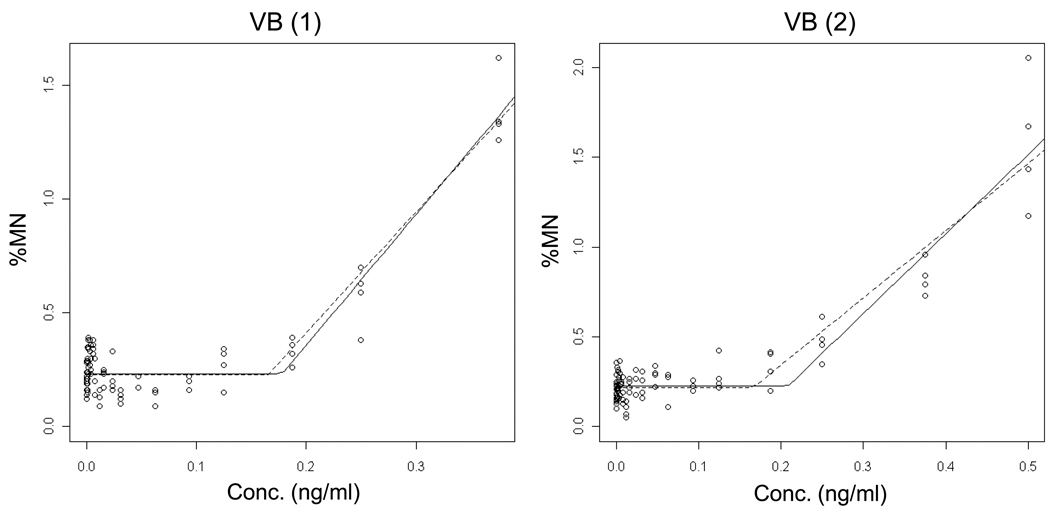
Figure 5.
Output from the hockey-stick program [19] is shown for two independent Vinblastine sulfate (VB) experiments. The frequency (%) of micronuclei determined via flow cytometric analysis is graphed as a function of VB concentration (ng/ml). Whereas the solid line indicates the best fit, the dashed line shows the hockey stick based on the lower limit of a confidence interval for the threshold dose. The results and statistically significant p-values suggest that the hockey stick model is a better description of the dose-response relationships than a linear fit.

