
Figure 2.
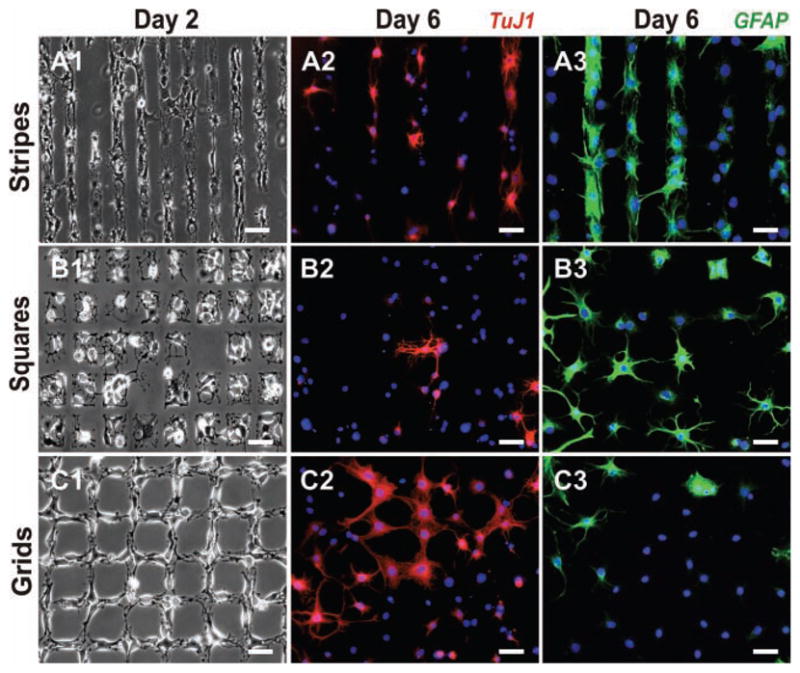
Growth and differentiation of NSCs on the laminin patterns. Phase contrast images show NSC attachment and growth on stripes (A1), squares (B1), and grids (C1) on Day 2 after seeding. Fluorescent images of cells stained for the neuronal marker TuJ1 (red) and nucleus (blue) show the extent of neuronal differentiation of NSCs on stripes (A2), squares (B2), and grids (C2) on Day 6 after seeding. Similarly, cells stained for astrocyte marker GFAP (green) and nucleus (blue) show the extent of glial differentiation on stripes (A3), squares (B3), and grids (C3) on Day 6 after seeding. Scale bars: 50 μm.