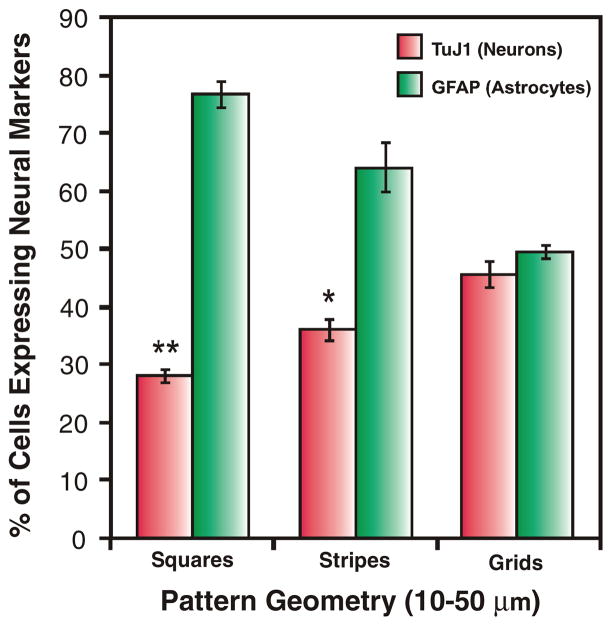
Figure 3.
Quantitative comparison of the percentage of cells expressing the neuronal marker TuJ1 and astrocyte marker GFAP on laminin patterns of squares, stripes and grids. Six days after seeding, the differentiated cells were counted and plotted as a ratio of TuJ1-positive cells or GFAP-positive cells to the total number of cells (n = 3). Student’s unpaired t-test was used for evaluating the statistical significance for cells stained for TuJ1 on stripes and squares, compared to those on grids. (* = P < 0.01, ** = P < 0.001).

