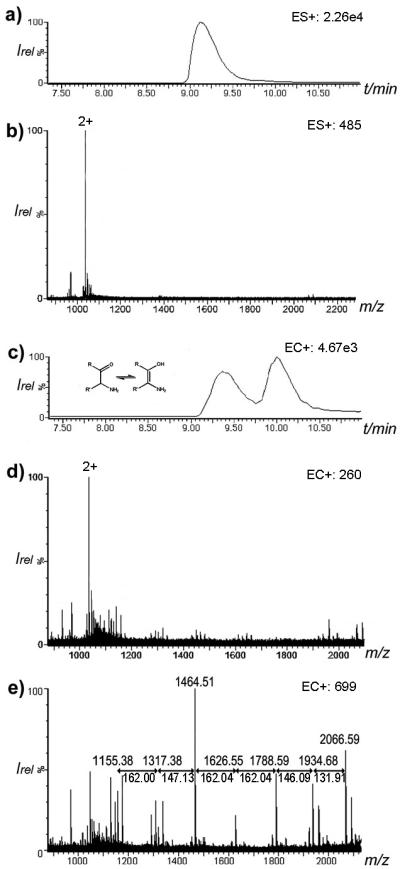
Figure 2.

Chromatogram and spectra of ristomycin A 1 using ESI and CD-ECI technique. a) ESI chromatogram of 1, and b) ESI spectrum of 1 showing the expected doubly charged ions at m/z = 1034.39. c) CD-ECI chromatogram of 1 showing two coeluting peaks; d) spectrum of the first peak of 1 in CD-ECI and e) spectrum of the second peak of 1 in CD-ECI (all in ToF mode).
