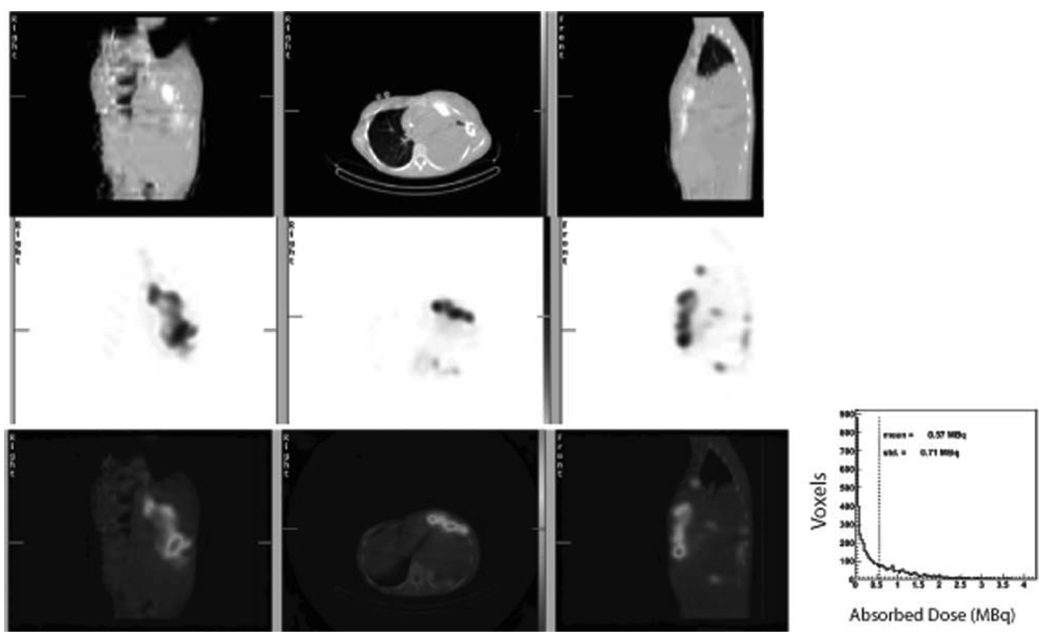
Figure 3.
Heterogeneity of activity distribution is shown. The fused single-photon emission computed tomography (SPECT)/computed tomography (CT) from Patient 4 (Table 1) shows nonuniform distribution of activity in the large chest wall mass. The top row shows a coronal (left), axial (center), and sagittal (right) CT image. The center row shows corresponding SPECT images, and the bottom row shows the fused images. The extent of the heterogeneity in the distribution of activity is quantified in the histogram (inset). The histogram shows the amount of uptake at 4 hours postinfusion for each voxel in the large anterior tumor. The mean voxel activity (voxel size = 4.42 × 4.42 × 4.42 mm3) at 4 hours was 0.57 MBq, with a standard deviation of 0.71 MBq. This degree of heterogeneity is typical of most tumors quantified with SPECT imaging.

