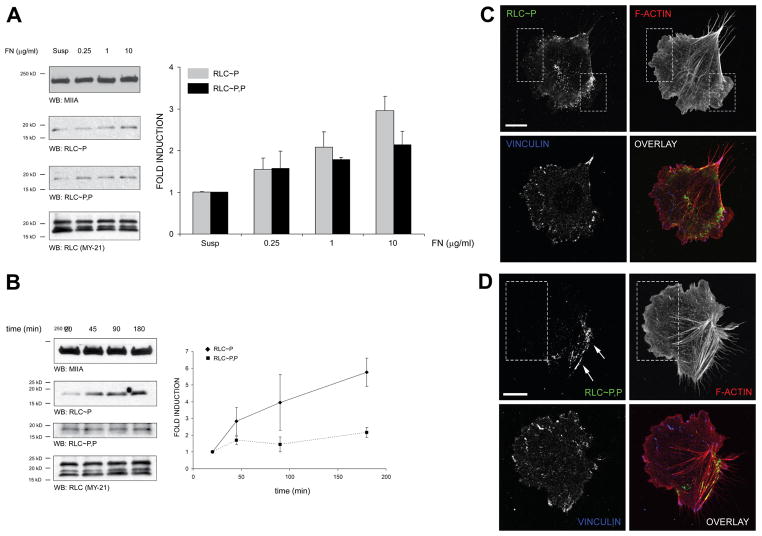
Figure 1. Adhesion to fibronectin promotes RLC mono (Ser19)- phosphorylation (RLC~P) and di (Thr18+Ser19)-phosphorylation (RLC~P,P) in an asymmetric manner.
(A) CHO.K1 cells were plated for 45 min on different doses of fibronectin. Cells were then lysed, proteins separated by SDS/PAGE, transferred to PVDF membranes and probed for RLC~P and RLC~P,P by immunoblotting. Membranes were also probed for MHCII-A (top) and then reprobed for total RLC (bottom). A representative experiment out of three performed is shown. Right, densitometric analysis of the three experiments performed in these conditions. Average fold induction ± standard deviation is calculated with respect to the normalized value for suspended cells.
(B) CHO.K1 cells were plated for the indicated time points on 1 μg/ml fibronectin-coated dishes and probed as in (A). A representative experiment out of three performed is shown. Right, densitometric analysis as in (A). Data is normalized with respect to the value at 20 min.
(C–D) CHO.K1 cells were plated for 45 min on 2 μg/ml fibronectin-coated coverslips, fixed and permeabilized. RLC~P (C) and RLC~P,P (D) were then visualized by indirect immunofluorescence. Cells were co-stained as indicated to visualize F-actin (using phalloidin) and vinculin to visualize adhesions. Dotted boxes denote protrusions, which contain RLC~P, but not RLC~P,P; arrows point to RLC~P,P-decorated bundles. Representative cells from >200 visualized are shown. Bar = 10 μm.

