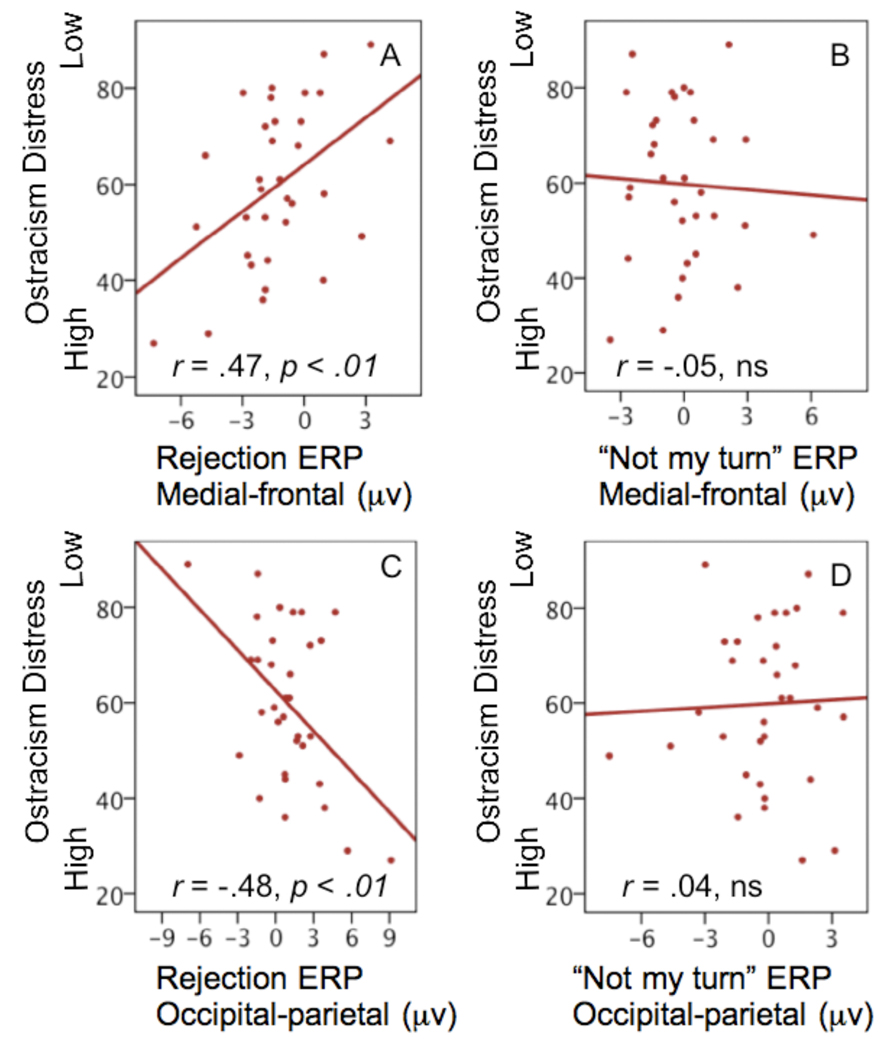
Figure 3. Scatter plot for ostracism distress scores (Y-axis) and mean slow wave data for rejection events and “not my turn” events (X-axes).
(A) Scatter plot of mean slow wave data for rejection ERP and ostracism distress at the medial frontal region. (B) Scatter plot of mean slow wave data for “not my turn” ERP and ostracism distress at the medial frontal region. (C) Scatter plot of mean slow wave data for rejection ERP and ostracism distress at the occipital-parietal region. (D) Scatter plot of mean slow wave data for “not my turn” ERP and ostracism distress at the occipital-parietal region.

