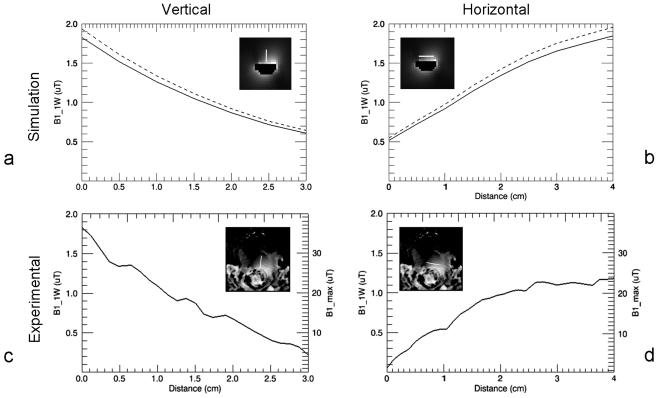
Figure 4.
B1+ profiles for the trERC. The line within each plots inset picture shows the location at which the profile was obtained. Vertical profiles from simulation (a) and measurement (c) from the middle of the prostate starting from the rectal wall and extending 3 cm anteriorly. Horizontal profiles from simulation (b) and measurement (d) approximately parallel to surface of the trERC and 1 cm in from the most anterior aspect of the rectum. All profiles are scaled to 1W input power. Simulated data (a) and (b) show both the original calculated B1+ profiles (broken curve) and the B1+ scaled by coil efficiency Ceff (solid curve). Experimental profiles (c) and (d) are also scaled for maximum achievable B1+ (B1_max) with the currently available transmit chain.

