
Figure 3.
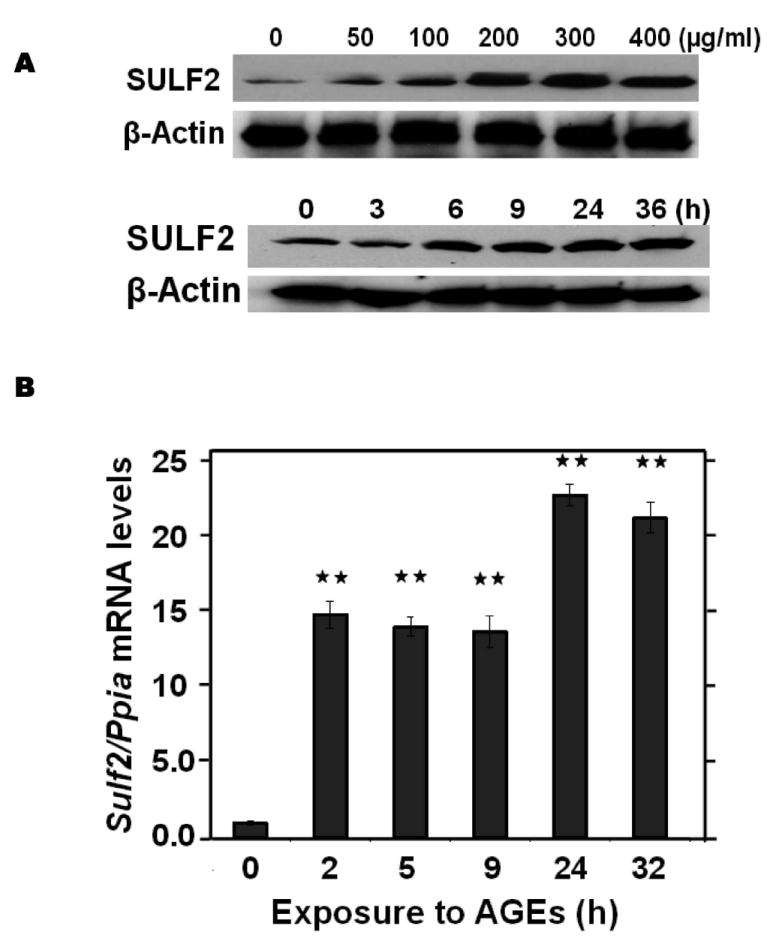
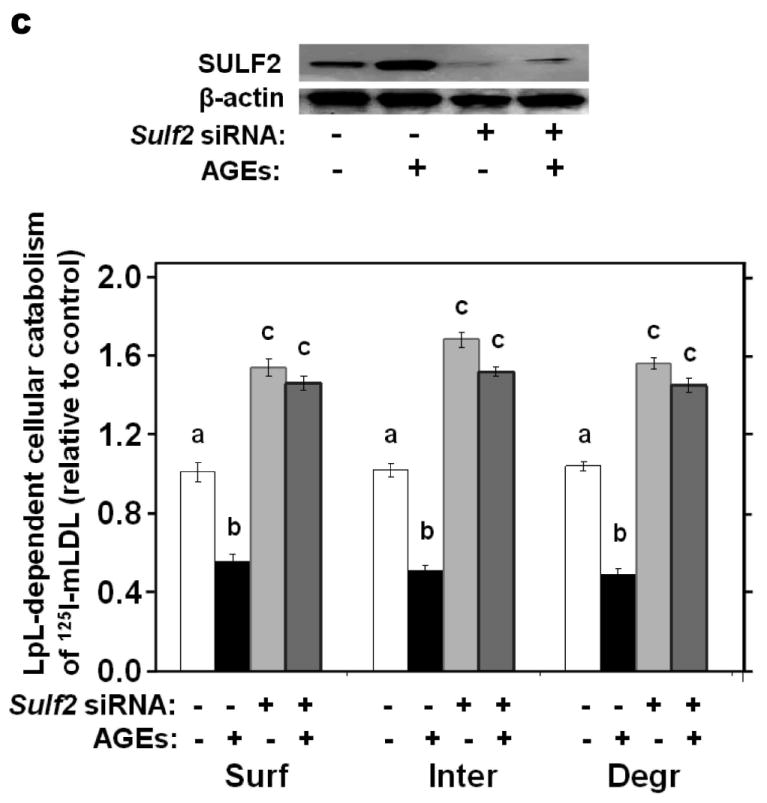
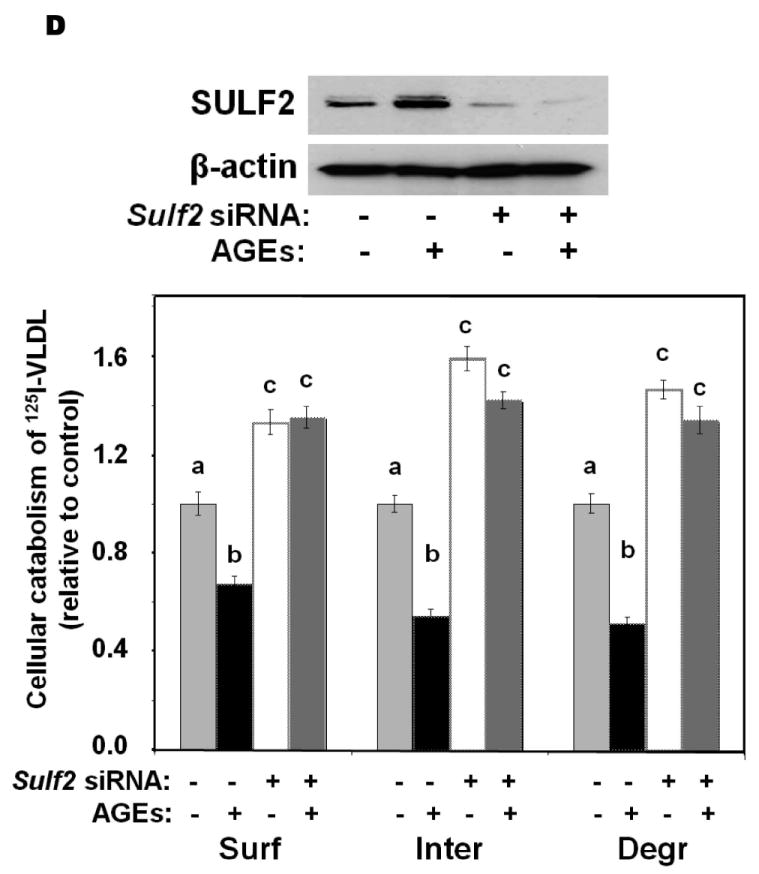
Advanced glycosylation end-products (AGEs) augment expression of SULF2 by cultured liver cells, thereby inhibiting catabolism of model remnant lipoproteins and VLDL.
Panel A: Dose-response (upper images) and time course (lower images) of SULF2 protein induction by AGEs. The dose-response involved a 24-h incubation of McArdle hepatoma cells with the indicated concentrations of AGEs, plus an amount of BSA to bring the total supplemented protein in each well to 400 μg/ml. As described in the Methods, cells in each time course of SULF2 regulation in vitro were harvested simultaneously. Here, 200 μg AGEs/ml was added at the indicated times before harvest. Displayed are immunoblots of cellular homogenates, using anti-SULF2 or anti-ß-actin antibodies. Panel B: Time course of Sulf2 mRNA induction by AGEs (200 μg/ml). Displayed are Sulf2 mRNA levels assayed by qPCR, normalized to Ppia mRNA levels, and then expressed relative to the unexposed control at 0 h (means±SEM, n=3). P<0.001 by ANOVA; **, P<0.01 compared to the unexposed control by the Student- Newman-Keuls test. Panels C and D: Effects of AGEs on catabolism of remnant lipoproteins (C) or VLDL (D) by cultured liver cells, without and with SULF2 knock-down. McArdle hepatoma cells were incubated for three consecutive 24-h periods at 37°C. The first 24-h period was with 100nM non-target siRNA or Sulf2 siRNA, as indicated by minus (−) and plus (+) Sulf2 siRNA, respectively. Cells were rinsed to remove the siRNAs, then incubated in serum-containing medium for a second 24-h period. During the final 24h, 200μg of either BSA or AGEs per ml were added, as indicated by minus and plus AGEs, respectively. Lipoprotein catabolism was examined during the last 4h of this final 24-h period. The upper images in these two panels show immunoblots of cellular homogenates. In panel C, the column graph displays LpL-dependent surface binding, internalization, and degradation of model remnant lipoproteins, normalized to control values from cells treated with the non-target siRNA and without AGEs (means±SEMs, n=3; the non-normalized control values were 242±3.4, 626±7.1, and 103±4.6ng/mg, respectively). In panel D, the column graph displays normalized values for surface binding, internalization, and degradation of labeled VLDL (means±SEMs, n=3; the non-normalized control values were 18.58±0.3, 78.86±0.9, and 59.89±0.35ng/mg, respectively). Within each of the three displayed groups of quantitative data, P<0.001 by ANOVA, and columns labeled with different lowercase letters are statistically different by the Student-Newman-Keuls test (P<0.01). Displayed are data from representative experiments from a total of four independent dose-response, time-course, and lipoprotein catabolism studies.