
Figure 4.

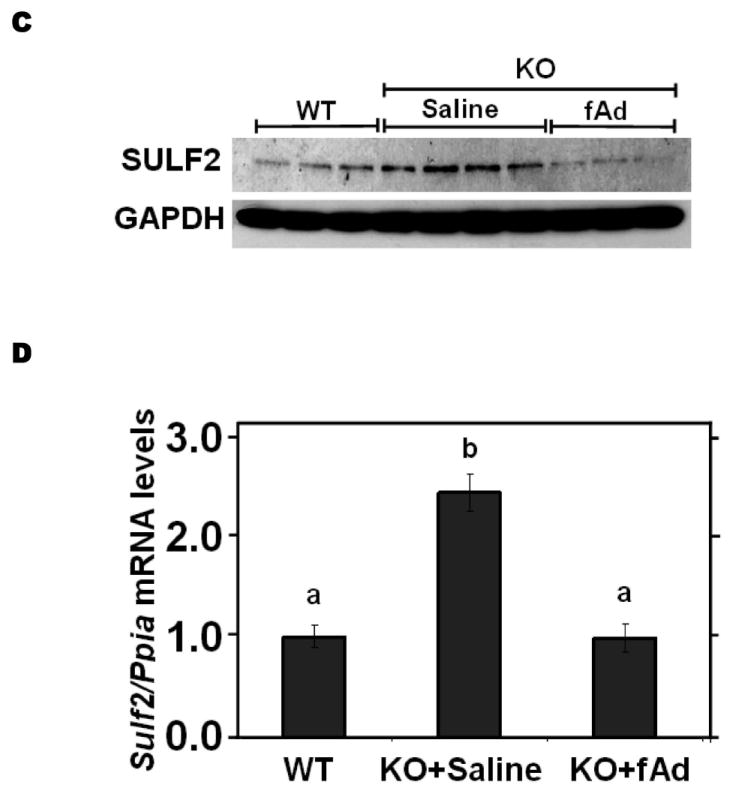
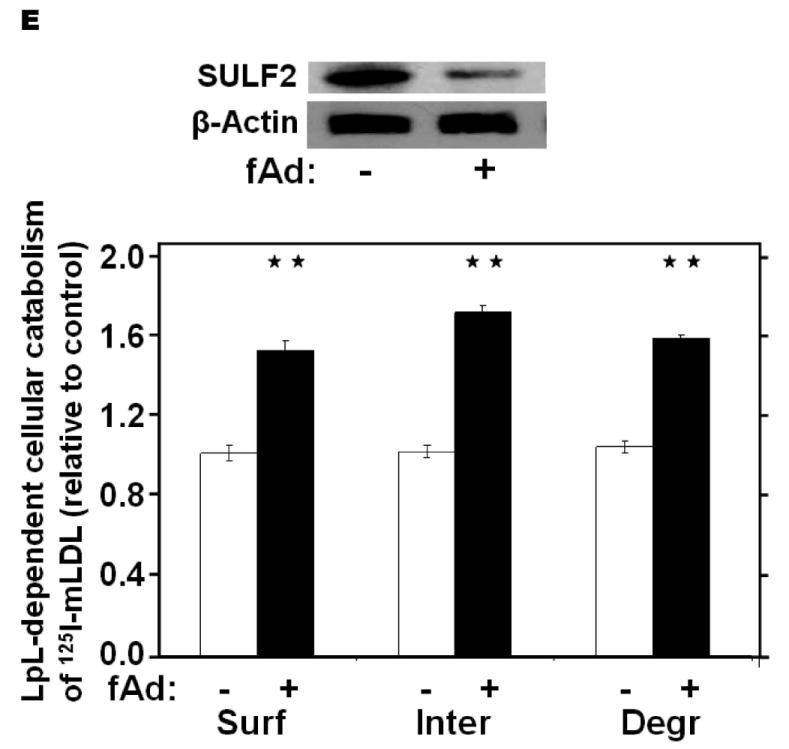
Adiponectin suppresses SULF2 expression by cultured liver cells and in murine livers in vivo, and enhances remnant lipoprotein catabolism in vitro. Panel A: Dose-response (upper images) and time course (lower images) of SULF2 protein suppression by adiponectin. The dose-response involved a 24-h incubation of McArdle hepatoma cells with the indicated concentrations of adiponectin, where zero indicates adiponectin-free medium. In the time course, 6 μg adiponectin/ml was added at the indicated times before harvest. Displayed are immunoblots of cellular homogenates. Panel B: Time course of Sulf2 mRNA suppression by a physiologic concentration of adiponectin (6 μg/ml). Displayed are Sulf2 mRNA levels, normalized to Ppia, and then expressed relative to the unexposed control at 0 h (means±SEM, n=3). P<0.001 by ANOVA; **, P<0.01 compared to the unexposed control by the Student-Newman-Keuls test. Panel C: Regulation of hepatic SULF2 protein levels by adiponectin in vivo. Protein was extracted from livers of wild-type C57BL/6J mice (WT, n=3) and adiponectinknockout mice that had been injected with either saline (KO+Saline, n=4) or fulllength adiponectin (KO+fAd, n=3, 25μg/mouse, three times/day for four days). Plasma adiponectin concentrations in these mice 4h after the last injection were 20.86±1.23, 0.41±0.013, and 6.16±1.08 μg/ml, respectively. Displayed are immunoblots for SULF2 and GAPDH. Panel D: Regulation of hepatic Sulf2 mRNA levels by adiponectin in vivo. RNA was extracted from the same livers as in Panel C. Levels of Sulf2 mRNA level were assessed by qPCR, normalized to Ppia, and then expressed relative to wild-type (means±SEM, n=3-4), P<0.001 by ANOVA. Columns labeled with different lowercase letters are statistically different by the Student-Newman-Keuls test (P<0.01). Panel E: Effects of adiponectin on remnant lipoprotein catabolism by cultured liver cells. McArdle hepatoma cells were incubated for 24h in adiponectin-free medium (minus symbols and open columns) or medium supplemented with 6 μg adiponectin/ml (plus symbols and black columns). The upper images show immunoblots of cellular homogenates. The column graph displays LpL-dependent surface binding, internalization, and degradation of model remnant lipoproteins, normalized to control values from cells incubated without adiponectin (means±SEMs, n=3; the non-normalized control values were 179±3.5, 618±43.4, and 37±1.1ng/mg, respectively). **, P<0.01 by the two-tailed Student’s t-test.