
Figure 5.
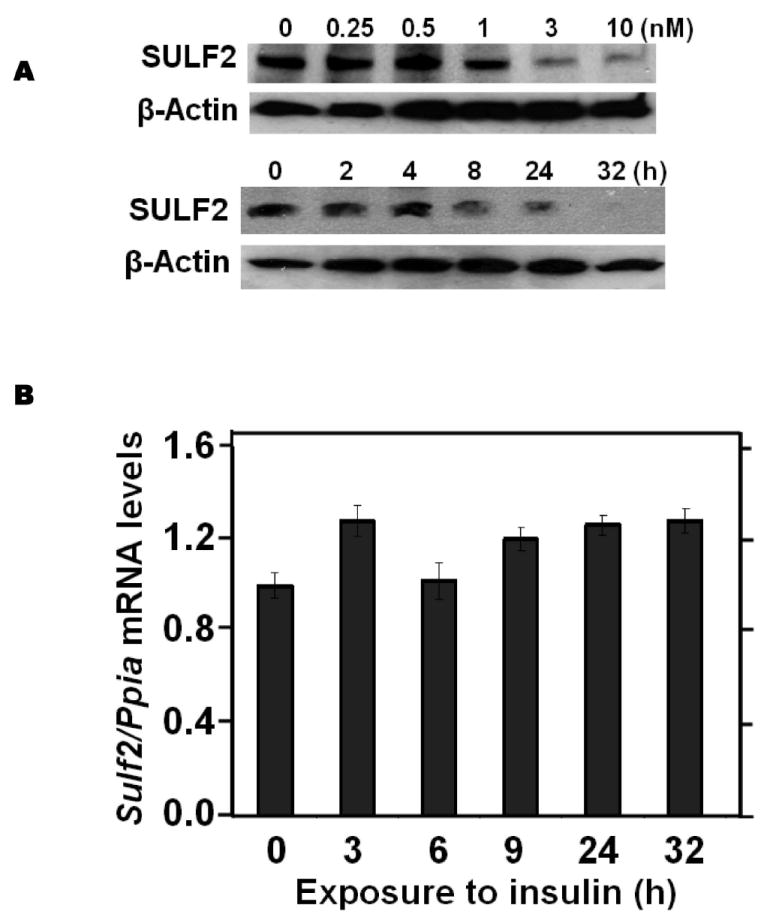
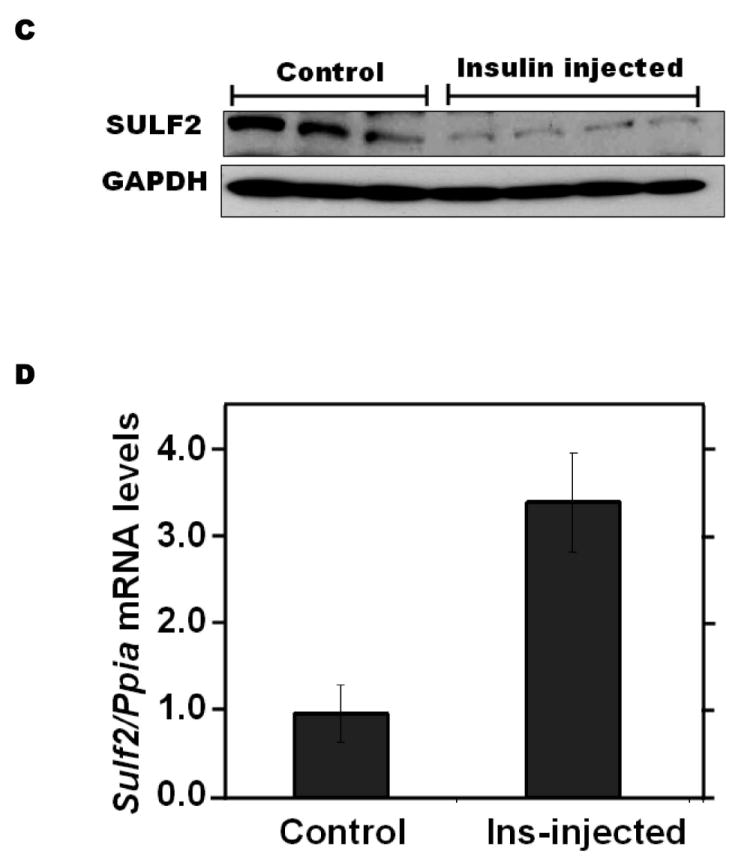

Insulin suppresses SULF2 protein, but not mRNA, in cultured liver cells and in murine livers in vivo, and enhances remnant lipoprotein catabolism in vitro.
Panel A: Dose-response (upper images) and time course (lower images) of SULF2 protein suppression by insulin. The dose-response involved a 24-h incubation of McArdle hepatoma cells with the indicated concentrations of insulin. In the time course, 3 nM insulin was added at the indicated times before harvest. Displayed are immunoblots of cellular homogenates. Panel B: Time course of Sulf2 mRNA levels during exposure to a physiologic concentration of insulin (3 nM). Displayed are Sulf2 mRNA levels, normalized to Ppia, and then expressed relative to the unexposed control at 0 h (means±SEM, n=3; N.S. by ANOVA). Panel C: Regulation of hepatic SULF2 protein levels by insulin in vivo. Sprague-Dawley rats were subjected to euglycemic-hyperinsulinemic clamps (4.8 mU insulin/kg/min) for four hours (Insulin injected); control rats received saline/glycerol. Protein was extracted from frozen liver samples. Displayed are immunoblots for SULF2 and GAPDH. Panel D: Hepatic Sulf2 mRNA levels after insulin injections in vivo. RNA was extracted from the same livers as in Panel C. Levels of Sulf2 mRNA were measured by qPCR, normalized to Ppia, and then expressed relative to control (means±SEM, n=3-4; N.S. by ANOVA). Panel E: Effects of insulin on remnant lipoprotein catabolism by cultured liver cells. McArdle hepatoma cells were incubated for 24h without (minus symbols and open columns) or with 10 nM insulin (plus symbols and black columns). The upper images show immunoblots of cellular homogenates. The column graph displays LpL-dependent surface binding, internalization, and degradation of model remnant lipoproteins, normalized to control values from cells incubated without insulin (means±SEMs, n=3; this experiment was performed simultaneously with the one displayed in Figure 4E). **, P<0.01 by the two-tailed Student’s t-test.