Figure 1.

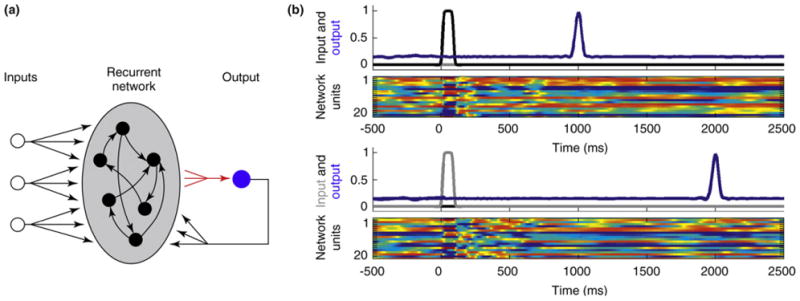
Simple interval timing with a population clock model. (a) The network architecture is composed of a population of 1500 firing-rate units (time constant 10 ms), all of which are connected to a single output unit that also provides feedback to the network. Each target output pattern (blue traces in panels b and c) is triggered by a combination of the three inputs to the network. Tonic input 3 sets the network to a ready state (not shown) and then pulses at inputs 1 or 2 are used to elicit either of two different trained output patterns. Training consists of adjusting the weights from the recurrent units onto the output unit (red arrows). Network architecture and the learning rule used to train the weights onto the output units were similar to those reported by Sussillo and Abbott [58]. The network connectivity matrix was sparse with probability of connection p = 0.1 and synaptic strength factor g of 1.35. A noise ‘current’ from a uniform distribution with a maximal amplitude of 0.001 was present in all the units. It should be stressed that although these simulations are biologically realistic in the sense that they rely on the interaction of neuron-like units, future work must use spiking units with realistic synaptic dynamics. In addition, the precise role of feedback when using nonperiodic targets must be examined; indeed, similar results can be obtained in the absence of feedback. (b) The upper panel shows the activity of the output unit trained to generate a delayed pulse-like response at 1 s to input 1 at time zero (traces from three different trials are overlaid). The lower panel shows a sample of the activity of the units in the recurrent network. The activity level of the recurrent units is color-coded and bounded between −1 (blue) and 1 (red). Input and output activity is normalized to the corresponding maximum value. (c) The same network shown in panel b generates an output pulse at 2 s in response to a pulse in input 2 at time zero (three traces overlaid).
