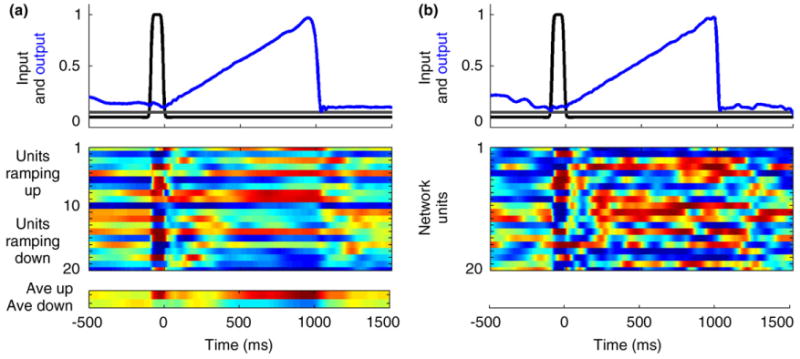
Figure 3.

Ramping output. Dynamics or the regime in the network is governed in part by the synaptic strength factor g that scales the weights in the recurrent network. A value of g < 1 leads to decaying activity, whereas values greater than 1 make the network increasingly chaotic. (a) In this simulation, the internal synaptic strength factor was at the low end of the g>1 regime (g = 1.25) and the output unit was trained to ramp linearly from 0 to 1000 ms. In this regime, many of the neurons in the recurrent network exhibit approximately linear (graded color transitions) responses during the trained interval (raster plot shows selected units grouped according to whether they exhibit a positive or negative slope; average of ramping up and ramping down units shown below). Input and output are normalized to the corresponding maximum value. (b) When the internal synaptic coupling is increased (g = 1.5) the internal dynamics of the network becomes more complex and most recurrent units do not ramp in a linear fashion; however, the output unit can still be trained to exhibit a linear ramp. The weights of the output to recurrent units were bounded between −0.5 and 0.5 in these simulations.
