Figure 3.
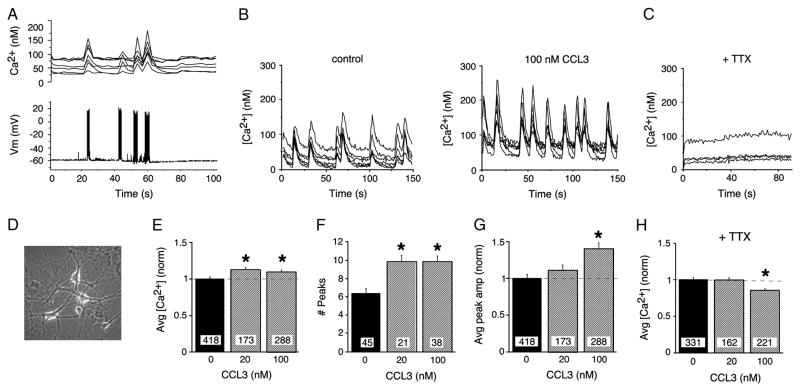
Chronic CCL3 treatment alters Ca2+ signaling in hippocampal neurons. A. Combined Ca2+ imaging and electrophysiological recording showing synaptic network activity in the recorded neuron and associated Ca2+ signals in the recorded neuron and other synaptically connected neurons in the field. B. Representative recordings of spontaneous Ca2+ signals in control and chronic CCL3-treated hippocampal neurons in microscopic fields under study. C. Addition of TTX to hippocampal cultures blocks all spontaneous activity. D. Phase contrast micrograph showing live hippocampal neurons used for Ca2+ imaging studies. The neurons are growing on top of an astrocyte layer. E. Average Ca2+ levels in spontaneously active control and chronic CCL3-treated hippocampal neurons. F. Number of spontaneous Ca2+ signals in control and chronic CCL3-treated hippocampal neurons during a 150 s recording period. G. Average peak amplitude of spontaneous Ca2+ signals in control and chronic CCL3-treated neurons. H. Effect of chronic CCL3 treatment on resting (TTX-treated) Ca2+ levels in control and chronic CCL3-treated hippocampal neurons. All graphs show mean values ± SEM. In E,G and H, measurements for CCL3-treated and control neurons were normalized to the mean value for control neurons in sibling cultures (normalized data). Dashed lines represent control levels. Numbers in boxes are the number of neurons studied. * Statistically significant (p<0.05) compared to control.

