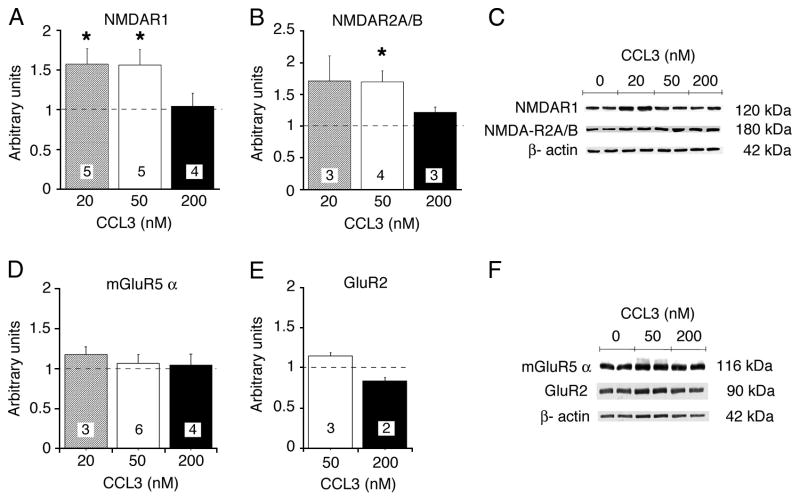
Figure 5.
Immunoblot analysis of glutamate receptor subunits. A–E. Relative levels of NMDAR1, NMDAR2A/B, mGluR5α and GluR2 in CCL3-treated cultures. Graphs show mean values ± SEM for CCL3-treated cultures relative to control cultures (normalized data). Dashed lines represent control levels. Numbers in boxes are number of cultures used for the experiment. C,F. Representative immunoblots. * Statistically significant (p<0.05) compared to control.

