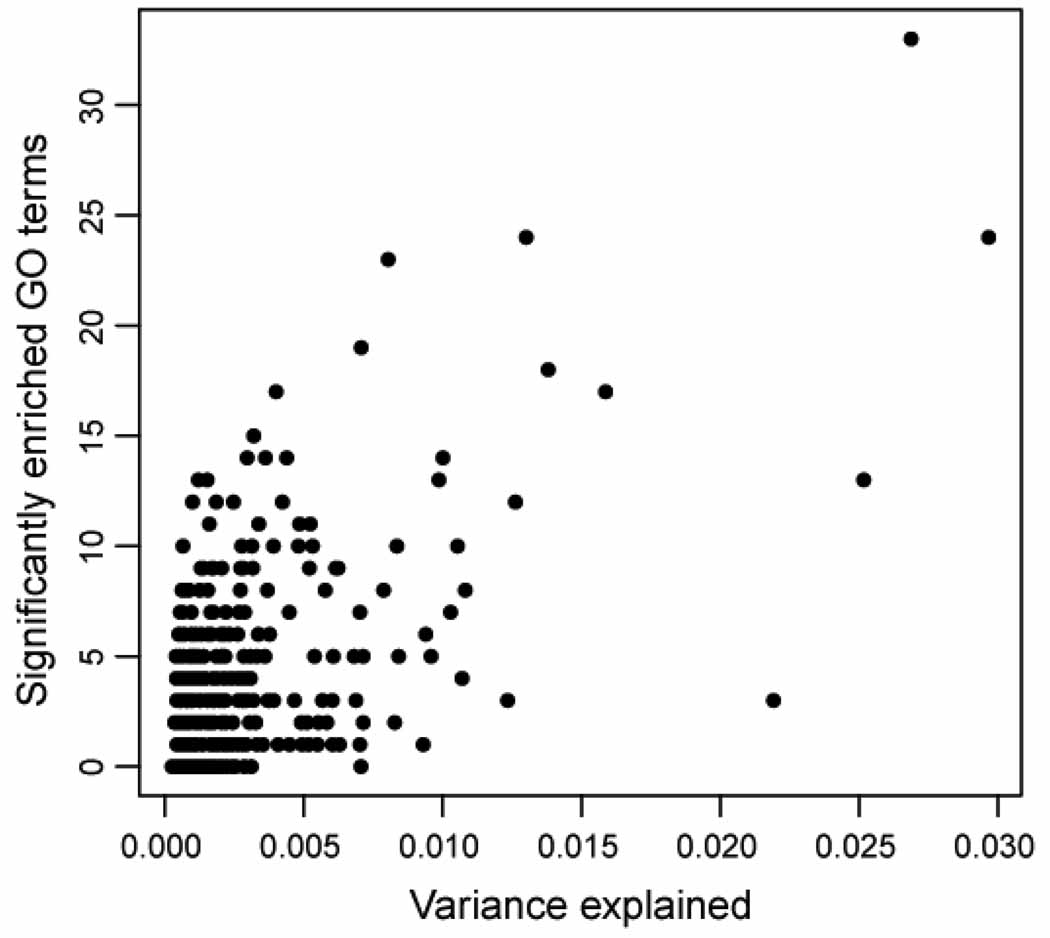
Figure 3.
Correlation between variance explained and enriched GO categories. We analyzed the active genes in the two modules associated with each FC and plotted the total number of enriched GO categories for a component versus the fraction of variance explained. Some FCs that explain a small percentage of variance have many enriched GO categories, suggesting that they represent rare but relevant expression profiles.

