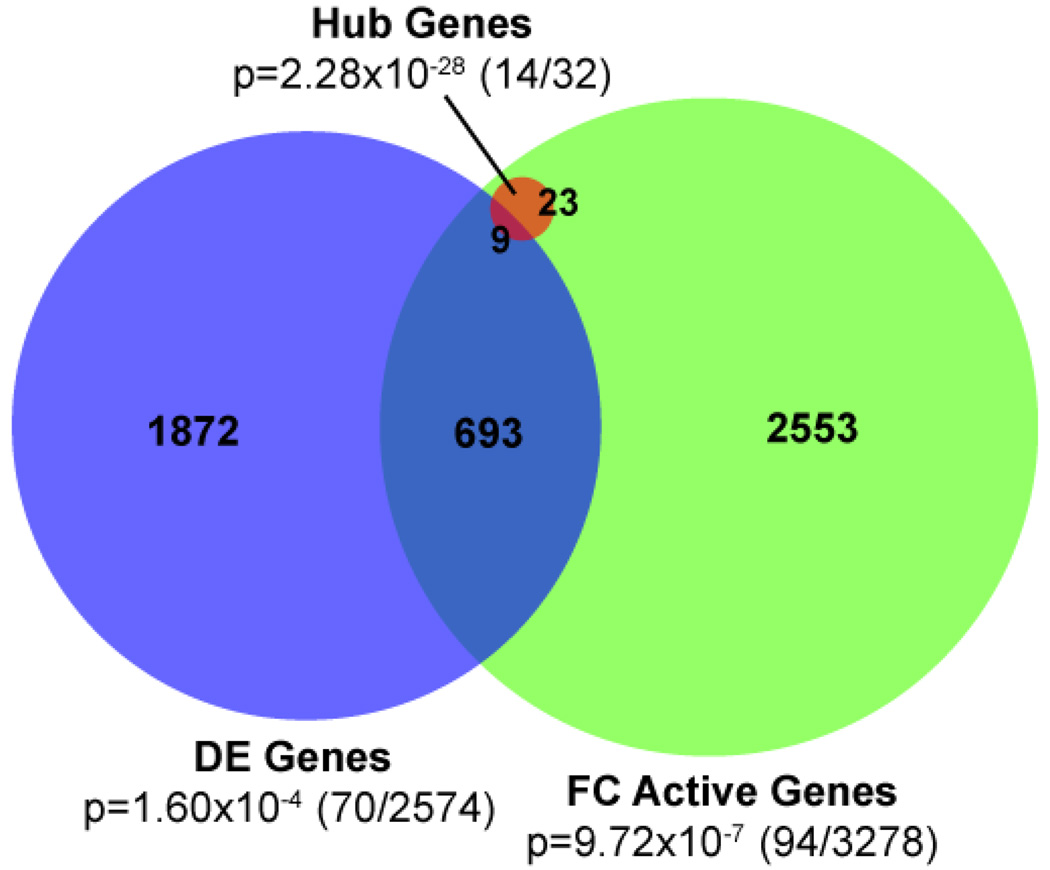
Figure 6.
Comparison of differential expression analysis of GSE7538 in gene- and fundamental component feature-space. We defined hub genes as the most highly-connected 1% of the 3,278 genes active in at least one of the differentially expressed FCs. P-values denote enrichment of known PTL-associated genes in each group, calculated using the hypergeometric test. Fractions represent the number of known PTL-associated genes and the total number of genes in each set (known/total).
Note: All figures except Figure 3 should be reproduced in color on the Web and on print.

