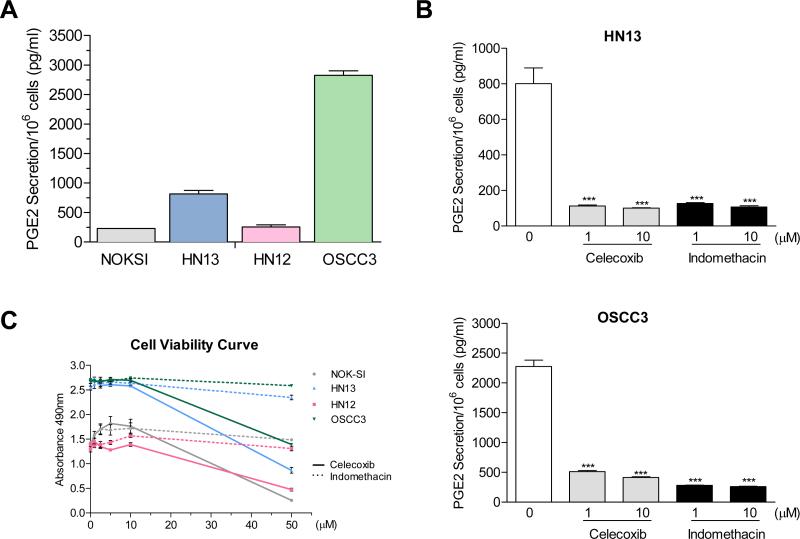
Figure 4. PGE2 secretion in HNSCC cells.
A. PGE2 secretion levels in NOK-SI, HN13, HN12, and OSCC3 cells. B. PGE2 secretion inhibition in OSCC3 and HN13 as representative cells treated with celecoxib and indomethacin for 24h. No differences were observed regarding the COX-2 selectivity of these drugs. Lower doses (1 and 10 μM) were able to inhibit PGE2 secretion (p<0.001). C. MTS viability curve. Drug doses able to inhibit PGE2 secretion had no biological effects in both HNSCC cells and in NOK-SI after 24h of treatment. Similar results were observed after treatment for longer periods of time (2 and 3 days, not shown). Only higher doses decreased cell viability.

