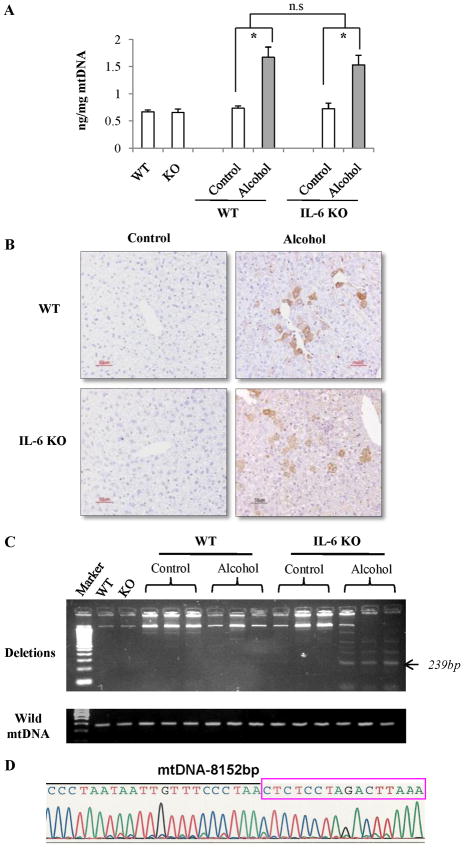
Figure 3. Oxidative mtDNA damage and deletion in IL-6 KO mice fed ethanol compared to WT mice.
(A) Levels of 8-OHdG in mtDNA of hepatocytes recovered from pair-fed and ethanol-fed mice. Data represent mean ± SEM (n= 3). n.s., no significant difference. *p<0.05. (B) Immunohistochemical staining for 8-OHdG. 8-OHdG-positive cells stained with brown color. (C) PCR analysis of mtDNA deletion. Each lane represents mtDNA extracted from one animal in each group. (D) The representative PCR products (239bp) were further analyzed by auto-sequencer. The 239-bp fragment was generated from mtDNA with the 4,834bp deletion which is located between 8,152bp and 12,986bp.

