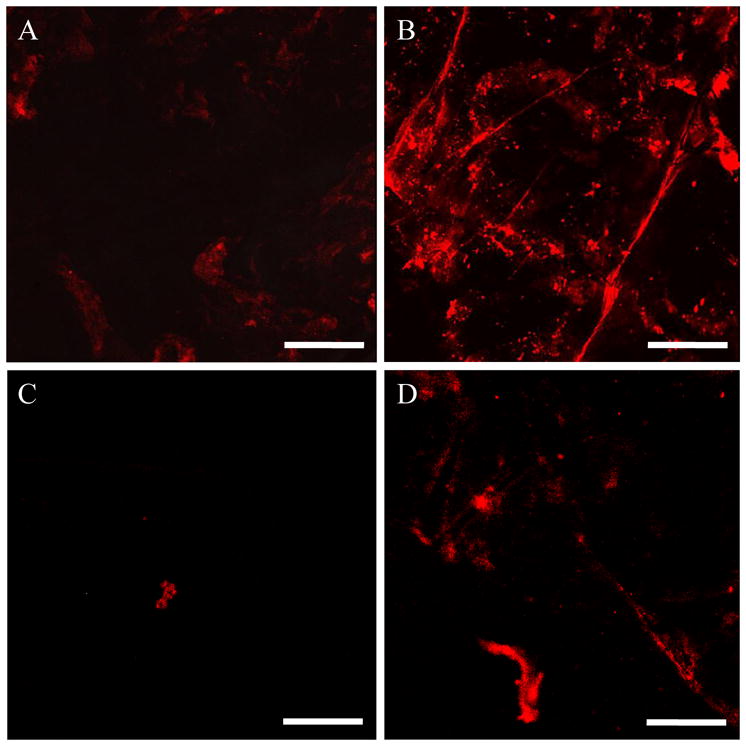
Figure 2.

Confocal images of selected regions of interest in the skin after 24 h of QD penetration into skin. (A) Surface of the stratum corneum (SC) after QD C penetration into untreated skin, (B) Surface of the SC after QD C penetration in US/SLS-treated skin, (C) Optical section of the isolated dermis, made parallel to the epidermis-dermis surface at a depth of 25 μm below the surface, after QD D penetration into untreated skin, and (D) Optical section of the isolated dermis, made to a depth of 25 μm below the surface, after QD D penetration into US/SLS-treated skin. Brightness/contrast enhancement was applied to (C) and (D). Bar = 200 μm.
