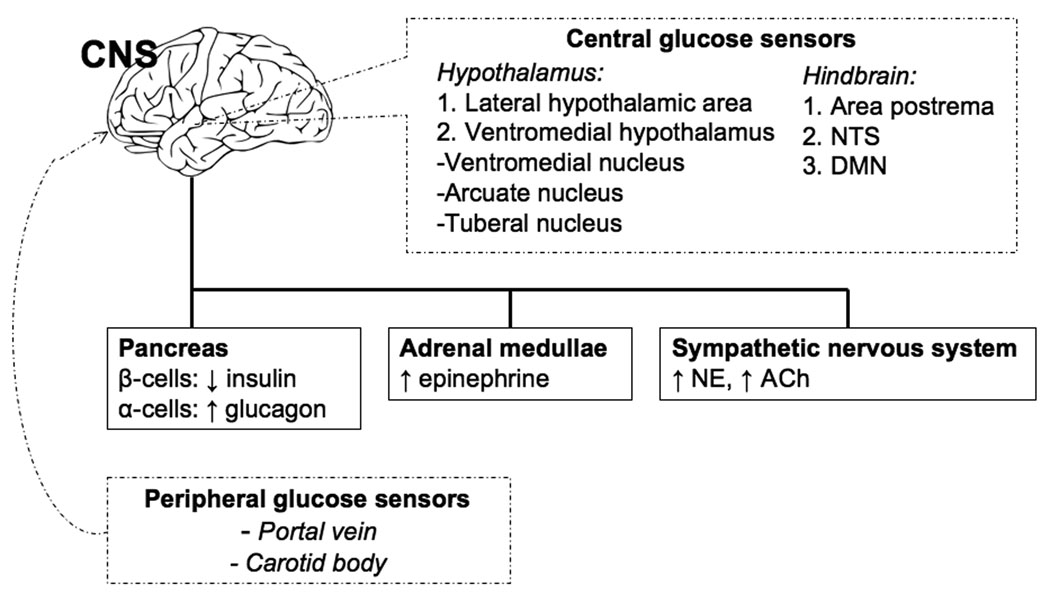
Figure 1.
Neuroendocrine network coordinating the response to acute hypoglycemia. Dashed lines represent areas of glucose sensing. Dark lines represent areas involved in counterregulation. CNS, central nervous system; NTS, nucleus of the solitary tract; DMN, dorsal motor nucleus of the vagus; ↓, decreased; ↑, increased; NE, norepinephrine; ACh, acetylcholine.

