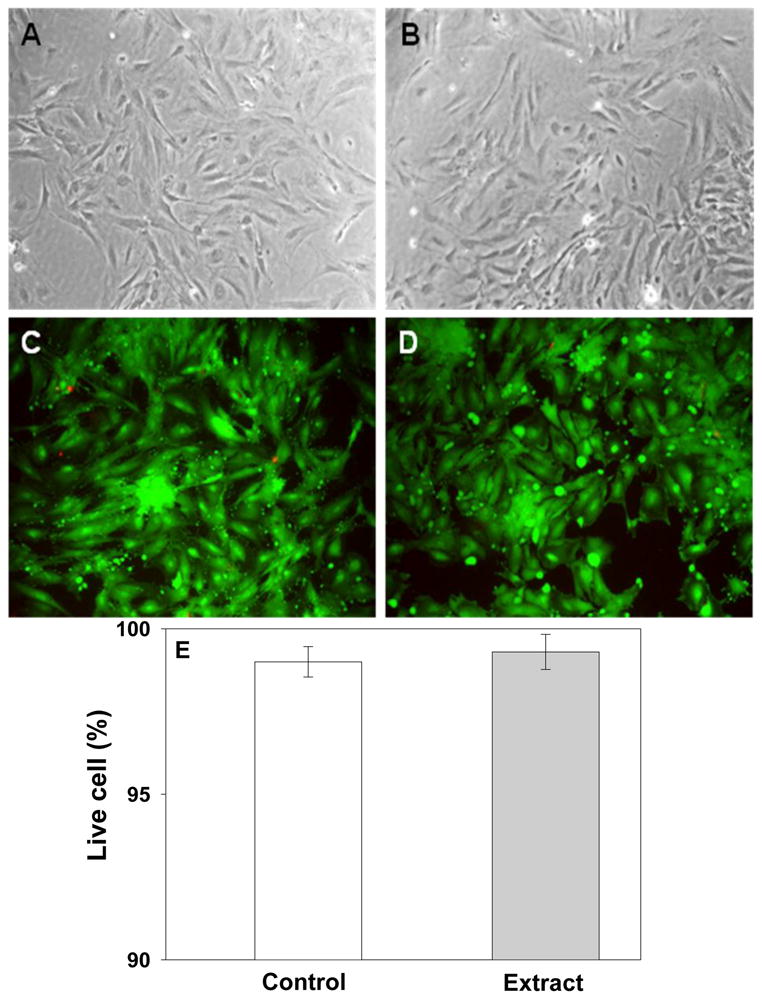
Fig. 6.

In vitro cytotoxicity of ESHU toward baboon smooth muscle cells by MCDB extracts for 24 h at 37°C. Phase contrast of cell morphologies of control (A) and extract (B). No differences were observed between control and extract. Fluorescence images of cells of (C) control and (D) extract which stained with LIVE/DEAD assay reagent. All images produced mostly green fluorescence with a few red one. All images were taken with 200× magnification. (E) The percentage of live cells by LIVE/DEAD assay. Data are presented as mean±S.D (n=3).
