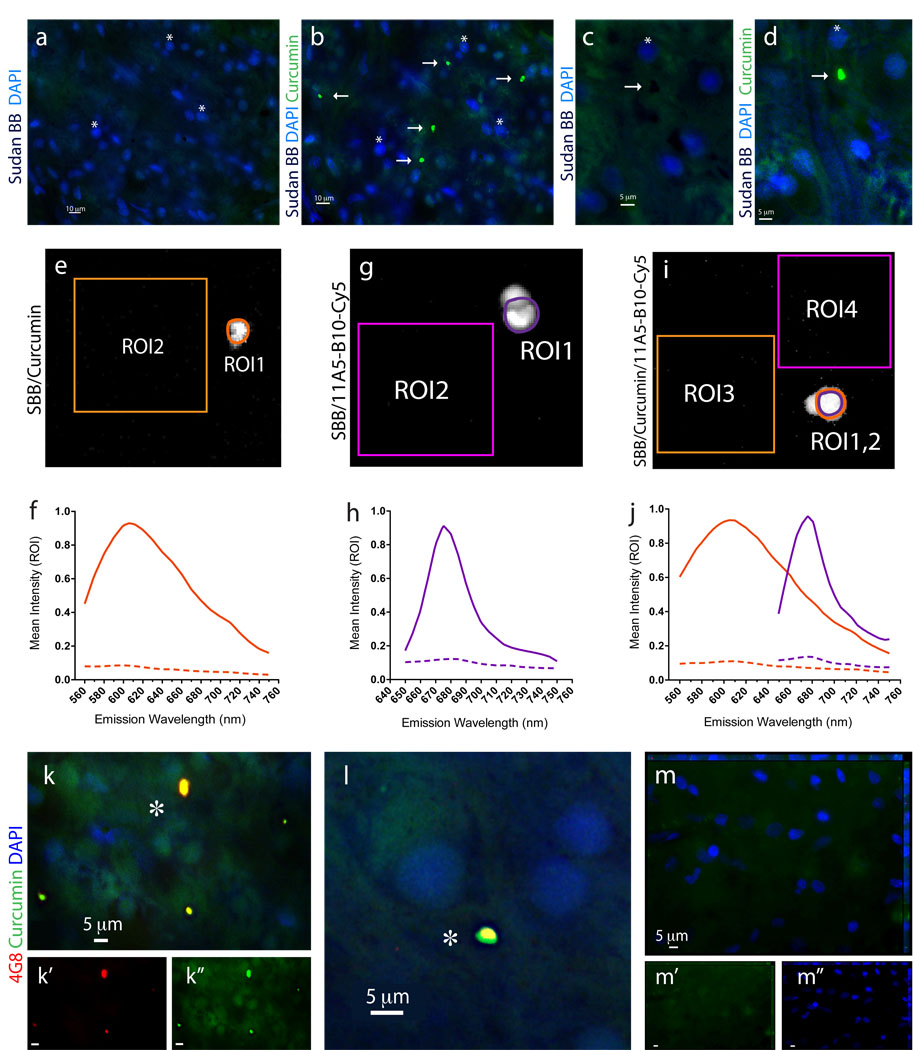
Figure 5.
Identification of Aβ plaques in the human retina of AD patients via a specific curcumin labeling. All stainings of human whole-mount retinas included a Sudan Black B (SBB) pretreatment to eliminate non-specific autofluorescence signals. (a–d) Whole-mount retinas from human AD patients were first immersed with SBB and subsequently stained with curcumin and DAPI; (a,c) no plaques were observed after staining with SBB, whereas (b,d) subsequent staining of the same human retinas with curcumin revealed the presence of Aβ plaques (indicated by arrows; asterisks mark the nuclei of the same tissue location). (c,d) At higher magnification, dark spots of SBB staining are evident, and following curcumin staining a specific Aβ plaque signal is detected in the same retinal location. (e–j) Signal specificity of individual retinal Aβ plaques, single-labeled with curcumin or with anti-Aβ40 (11A5-B10; secondary Ab-Cy5 conjugate), or double-labeled with both, was confirmed by spectral image analysis performed in quadruplicates in a Leica SP5 WLL double-spectral confocal microscope. Regions of interest (ROI) were marked and their corresponding signal intensity was recorded at increasing emission wavelengths from 560 nm to 750 nm to create the spectral curves for Aβ plaques versus background. (e) Representative image of a single curcumin-labeled Aβ plaque in a retinal whole-mount (ROI1) and tissue background (ROI2) captured at excitation/emission wavelengths of 550/605 nm. (f) Spectral analysis curves of individual curcumin-labeled Aβ plaque, at excitation wavelength of 550 nm, as compared to tissue background (dashed line). (g) Representative image of single retinal Aβ plaque (ROI1) and background (ROI2) after staining with Cy5-antibody 11A5-B10 conjugate captured at excitation/emission wavelengths of 640/675 nm. (h) Spectral analysis curves of individual Cy5-antibody-labeled Aβ plaque, at excitation wavelength of 640 nm, as compared to tissue background (dashed line). (i.j) Representative image and spectra curves of retinal Aβ plaque double-labeled with curcumin (ROI1; orange line) and Cy5-antibody 11A5-B10 conjugate (ROI2; purple line), and corresponding background areas (ROI3 and ROI4; dashed lines), at excitation wavelengths of 550 nm (for curcumin spectra) and 640 nm (for Ab-Cy5 conjugate). Peak wavelengths for curcumin and Cy5-antibody captured in the same individual Aβ plaque are distinct and separable; they remain the same as after single stainings. (k–m) Whole-mount retinas from AD patients and normal control stained with curcumin and 4G8; (k,l) Aβ plaques indicated by asterisks show a single-globular compacted morphology. DAPI stains nuclei. (l) Higher magnification image of an extracellular Aβ plaque with compacted morphology. (m) No Aβ plaques were detected in retinas from normal controls.

