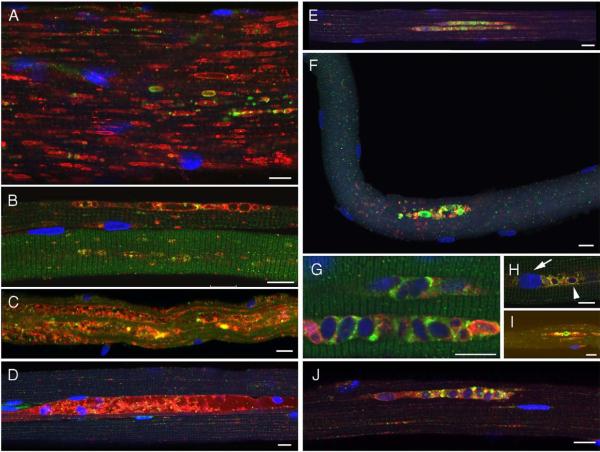
Fig. 6.
Autophagic accumulation is noticeable on ERT. Fibers from infants were stained for LAMP-2 (red)/LC3 (green). Left: a variable response to ERT in NBS6 (A), CLIN3 (B, D), and CLIN5 (C). Right: autophagic buildup emerges upon ERT [CLIN3 (E, G, H, J) and NBS4 (F, I)]. Bar: 10 microns. (For interpretation of the references to colour in this figure legend, the reader is referred to the web version of this article.)

