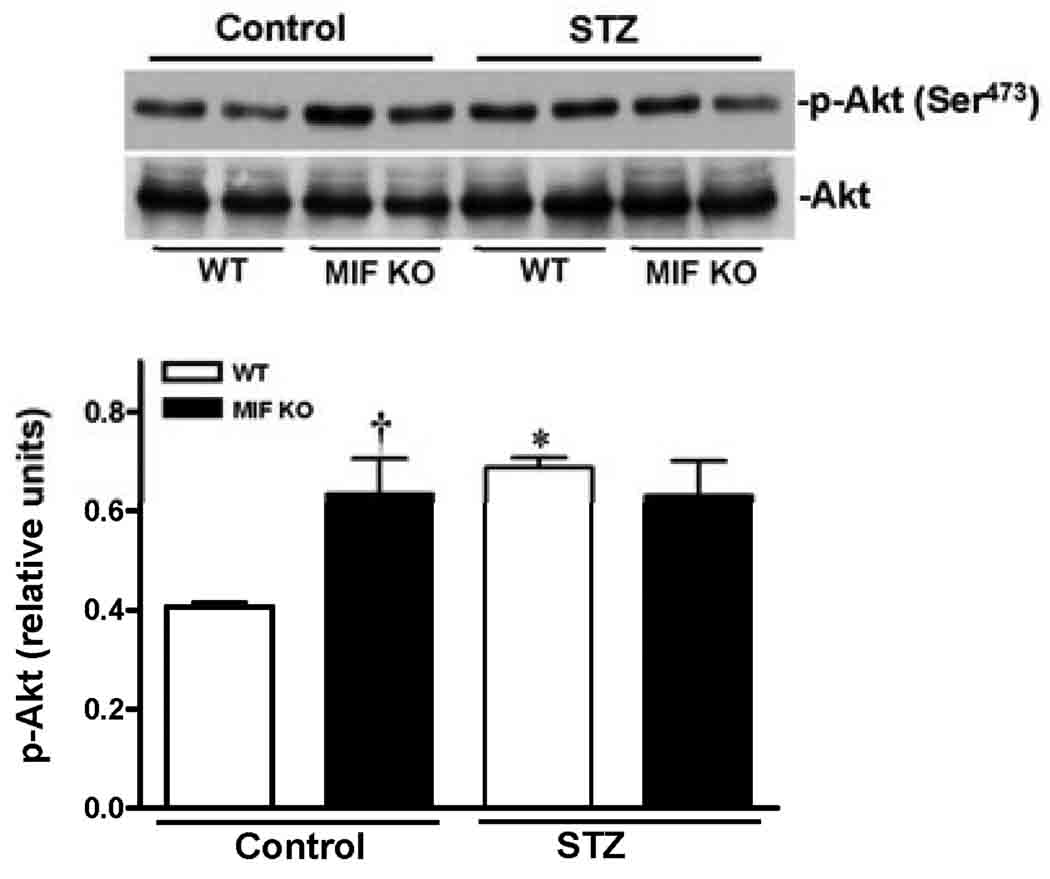
Figure 5.
Cardaic Akt signaling stimulated by STZ-induced T1D. Left ventricles from WT and MIF KO mice treated with or without STZ (200 mg/kg, i.p.) were used for making homogenates. Representative immunoblots of p-Akt (Ser473) and total Akt (upper panel), bars show the relative level of p-Akt in the hearts (lower panel). Mean ± SEM; n =4 samples per group, *p < 0.05 vs. control group, respectively; †p < 0.05 vs. WT control.

