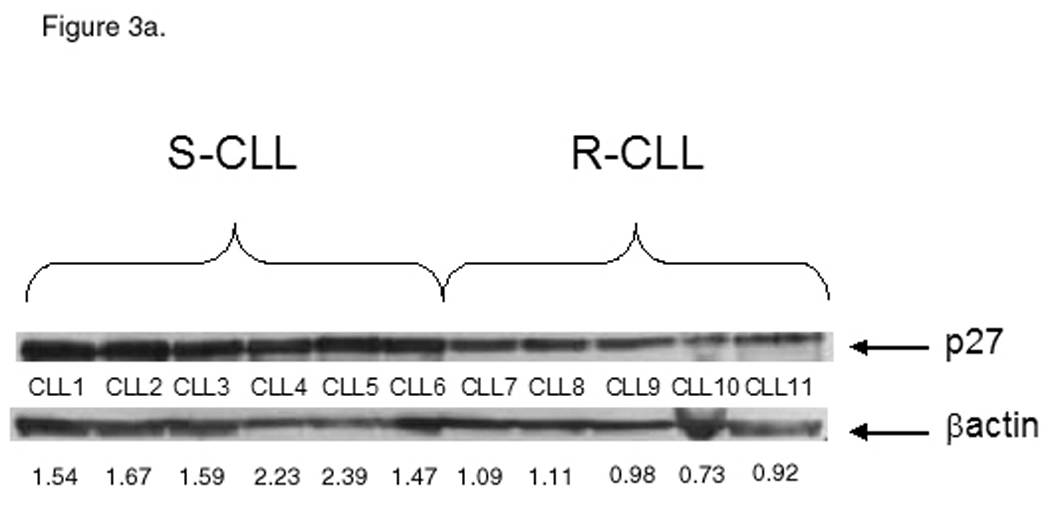
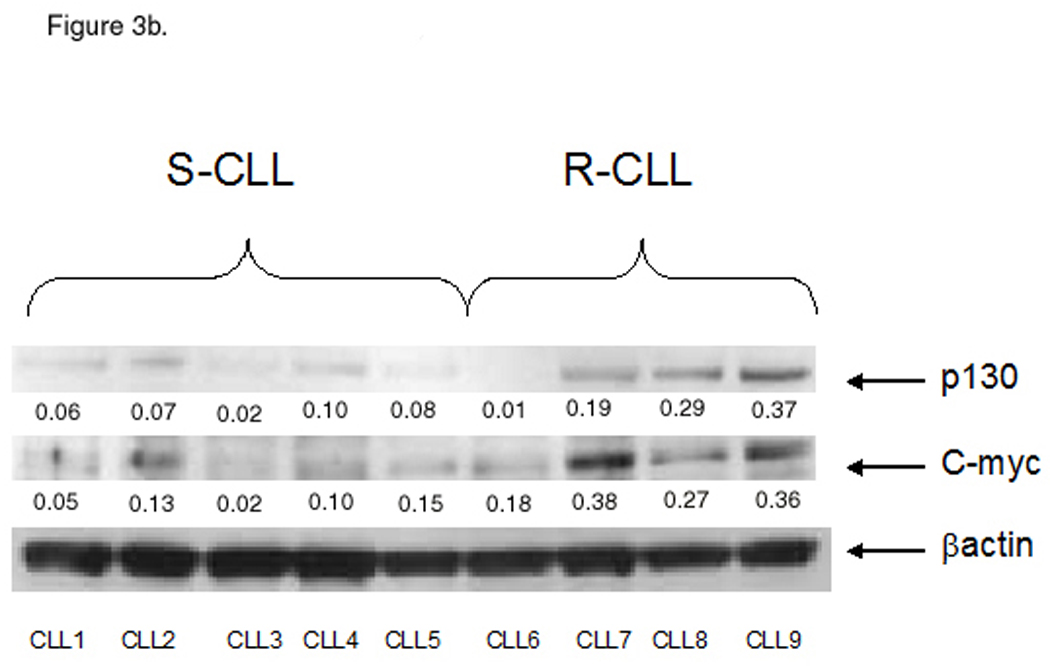
Figure 3.


Differential cell cycle distribution between the CLL subsets. A, S-CLL samples (1 through 6) express high baseline protein level of p27 compared with R-CLL (samples 7 through 11). B, S-CLL samples (1 through 5) express low baseline protein level of c-Myc and p130 compared with R-CLL (samples 6 through 9). Representative data of three independent experiments are shown.
