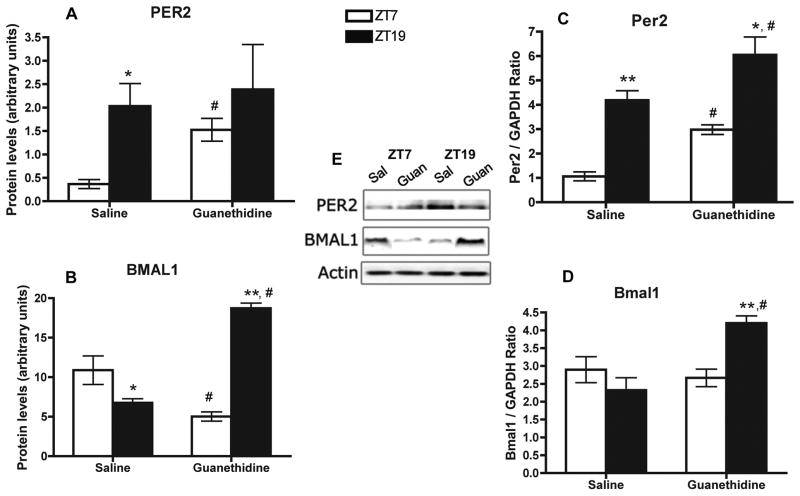
Fig. 3.
Effect of local splenic sympathectomy in daily clock gene expression. Protein levels of PER2 (A), and BMAL1 (B) in NK cells enriched at ZT7 and ZT19 from saline and guanethidine-treated spleens. Representative immunoblots, including actin (control), are shown. Levels of mRNA Per2 (C) and Bmal1 (D) in whole-spleen at ZT7 and ZT19. Data are mean ± SEM, n=4. * (p < 0.05), ** (p < 0.001), significant differences between time points within groups. #, significant difference (p < 0.01) between saline and guanethidine.

