


Figure 2.
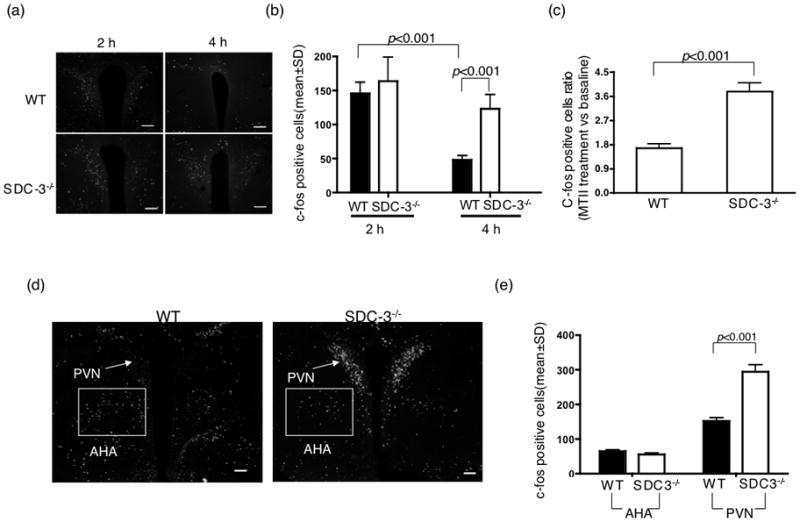
MTII-induced c-fos immunoreactivity in the paraventricular nuclei of SDC-3−/− and WT mice. (a) SDC-3−/− and WT mice were food deprived for 24 h and then injected with 3 mg/kg MTII. Mice were euthanized at 2 or 4 hours and processed as described in the methods (2.1.2). Representative sections from WT and SDC-3−/− mice are shown. (b) c-fos positive neurons were counted from all PVN containing sections. Data represent the mean ± s.d. P values are indicated in figure, SDC-3−/− vs. WT based on Student’s t test. (c) Analysis of c-fos activated neurons compared to baseline. CFLIR was quantified in brain sections obtained at 0 or 4 hrs post-MTII injection. Data are presented as ratio of MTII treated versus baseline and expressed as mean ± s.d. P values are indicated in figure, SDC-3−/− vs. WT based on a Student’s t test. (d) C-fos immunoreactivity in non-MTII activated neurons. 24-hour food deprived mice were injected with MTII (3 mg/kg) and euthanized 4 hours post-injection. (e) Sections containing both the PVN and anterior hypothalamic area (AHA) nuclei were quantified for CFLIR. Data represent the mean ± s.d. n = 3/group. P values are indicated in figure based on Student’s t test.